Native/Alaskan vs Guamanian/Chamorro Unemployment Among Women with Children Under 18 years
COMPARE
Native/Alaskan
Guamanian/Chamorro
Unemployment Among Women with Children Under 18 years
Unemployment Among Women with Children Under 18 years Comparison
Natives/Alaskans
Guamanians/Chamorros
7.2%
UNEMPLOYMENT AMONG WOMEN WITH CHILDREN UNDER 18 YEARS
0.0/ 100
METRIC RATING
328th/ 347
METRIC RANK
5.8%
UNEMPLOYMENT AMONG WOMEN WITH CHILDREN UNDER 18 YEARS
2.9/ 100
METRIC RATING
234th/ 347
METRIC RANK
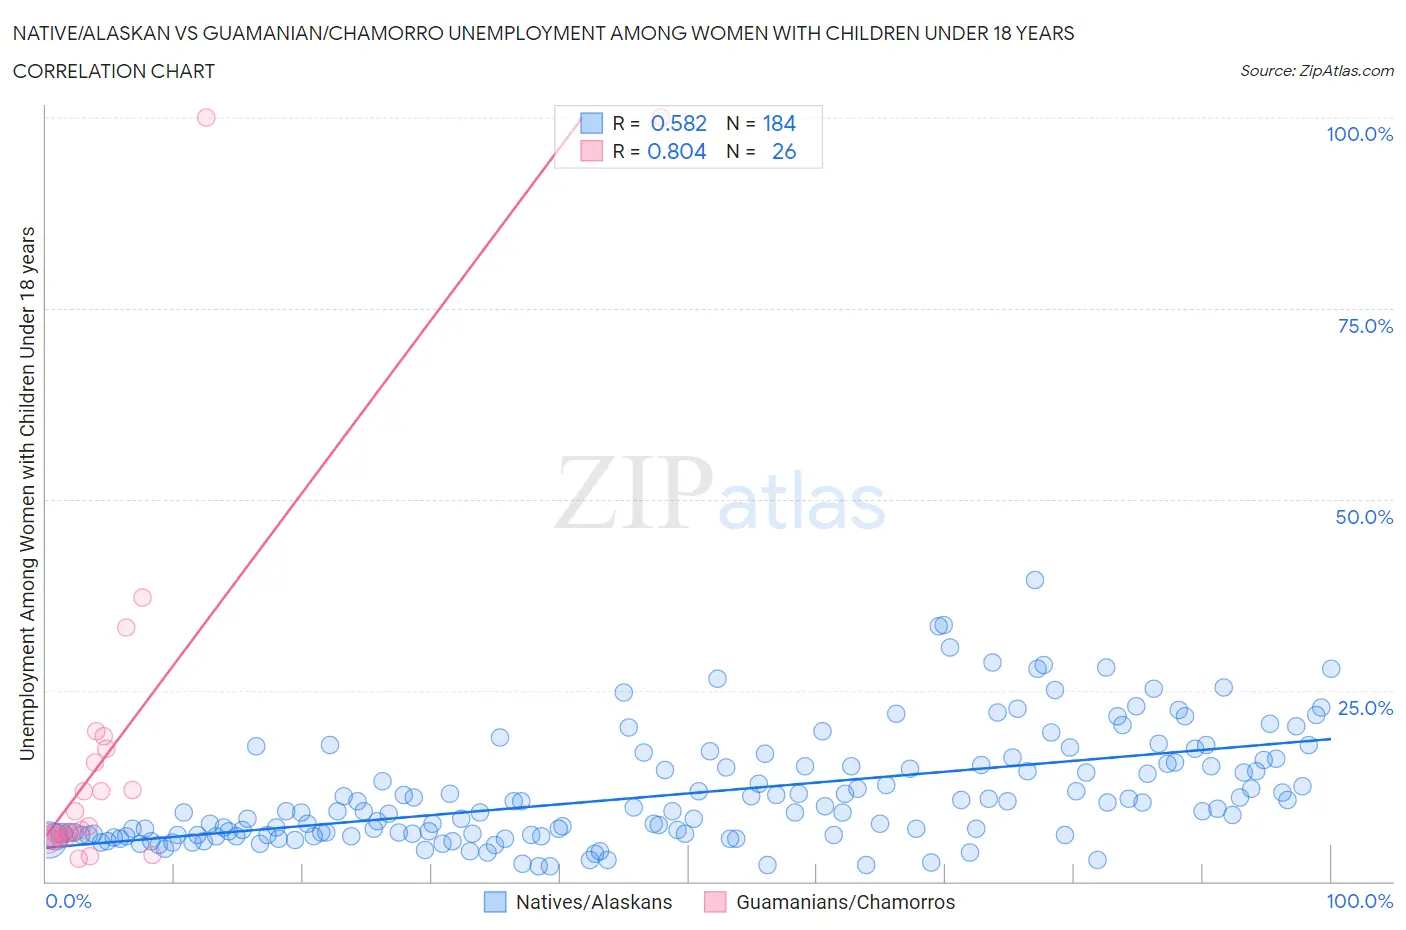
Native/Alaskan vs Guamanian/Chamorro Unemployment Among Women with Children Under 18 years Correlation Chart
The statistical analysis conducted on geographies consisting of 478,925,590 people shows a substantial positive correlation between the proportion of Natives/Alaskans and unemployment rate among women with children under the age of 18 in the United States with a correlation coefficient (R) of 0.582 and weighted average of 7.2%. Similarly, the statistical analysis conducted on geographies consisting of 217,637,806 people shows a very strong positive correlation between the proportion of Guamanians/Chamorros and unemployment rate among women with children under the age of 18 in the United States with a correlation coefficient (R) of 0.804 and weighted average of 5.8%, a difference of 25.3%.
Unemployment Among Women with Children Under 18 years Correlation Summary
| Measurement | Native/Alaskan | Guamanian/Chamorro |
| Minimum | 1.9% | 3.0% |
| Maximum | 39.5% | 100.0% |
| Range | 37.5% | 97.0% |
| Mean | 11.4% | 17.8% |
| Median | 9.1% | 6.9% |
| Interquartile 25% (IQ1) | 6.0% | 5.8% |
| Interquartile 75% (IQ3) | 15.1% | 17.3% |
| Interquartile Range (IQR) | 9.1% | 11.5% |
| Standard Deviation (Sample) | 7.3% | 25.7% |
| Standard Deviation (Population) | 7.3% | 25.2% |
Similar Demographics by Unemployment Among Women with Children Under 18 years
Demographics Similar to Natives/Alaskans by Unemployment Among Women with Children Under 18 years
In terms of unemployment among women with children under 18 years, the demographic groups most similar to Natives/Alaskans are Black/African American (7.3%, a difference of 0.41%), Colville (7.4%, a difference of 1.9%), Lumbee (7.1%, a difference of 2.4%), Hopi (7.4%, a difference of 2.4%), and Dominican (7.5%, a difference of 3.0%).
| Demographics | Rating | Rank | Unemployment Among Women with Children Under 18 years |
| U.S. Virgin Islanders | 0.0 /100 | #321 | Tragic 6.7% |
| Houma | 0.0 /100 | #322 | Tragic 6.8% |
| Pueblo | 0.0 /100 | #323 | Tragic 6.8% |
| Paiute | 0.0 /100 | #324 | Tragic 6.9% |
| Immigrants | Dominica | 0.0 /100 | #325 | Tragic 7.0% |
| Chippewa | 0.0 /100 | #326 | Tragic 7.0% |
| Lumbee | 0.0 /100 | #327 | Tragic 7.1% |
| Natives/Alaskans | 0.0 /100 | #328 | Tragic 7.2% |
| Blacks/African Americans | 0.0 /100 | #329 | Tragic 7.3% |
| Colville | 0.0 /100 | #330 | Tragic 7.4% |
| Hopi | 0.0 /100 | #331 | Tragic 7.4% |
| Dominicans | 0.0 /100 | #332 | Tragic 7.5% |
| Immigrants | Dominican Republic | 0.0 /100 | #333 | Tragic 7.5% |
| Cheyenne | 0.0 /100 | #334 | Tragic 7.8% |
| Apache | 0.0 /100 | #335 | Tragic 7.9% |
Demographics Similar to Guamanians/Chamorros by Unemployment Among Women with Children Under 18 years
In terms of unemployment among women with children under 18 years, the demographic groups most similar to Guamanians/Chamorros are Immigrants from Middle Africa (5.8%, a difference of 0.040%), Spanish American (5.8%, a difference of 0.11%), Creek (5.8%, a difference of 0.13%), Immigrants from Africa (5.8%, a difference of 0.15%), and Immigrants from South America (5.8%, a difference of 0.21%).
| Demographics | Rating | Rank | Unemployment Among Women with Children Under 18 years |
| Sierra Leoneans | 3.8 /100 | #227 | Tragic 5.8% |
| Somalis | 3.5 /100 | #228 | Tragic 5.8% |
| Immigrants | Panama | 3.4 /100 | #229 | Tragic 5.8% |
| Immigrants | South America | 3.2 /100 | #230 | Tragic 5.8% |
| Immigrants | Africa | 3.1 /100 | #231 | Tragic 5.8% |
| Creek | 3.1 /100 | #232 | Tragic 5.8% |
| Spanish Americans | 3.1 /100 | #233 | Tragic 5.8% |
| Guamanians/Chamorros | 2.9 /100 | #234 | Tragic 5.8% |
| Immigrants | Middle Africa | 2.8 /100 | #235 | Tragic 5.8% |
| Alsatians | 2.5 /100 | #236 | Tragic 5.8% |
| Immigrants | Lebanon | 2.4 /100 | #237 | Tragic 5.8% |
| Immigrants | Somalia | 2.2 /100 | #238 | Tragic 5.8% |
| Immigrants | Sierra Leone | 2.0 /100 | #239 | Tragic 5.8% |
| Immigrants | Immigrants | 2.0 /100 | #240 | Tragic 5.8% |
| Brazilians | 1.6 /100 | #241 | Tragic 5.8% |