Immigrants from Afghanistan vs African Unemployment Among Women with Children Under 18 years
COMPARE
Immigrants from Afghanistan
African
Unemployment Among Women with Children Under 18 years
Unemployment Among Women with Children Under 18 years Comparison
Immigrants from Afghanistan
Africans
5.5%
UNEMPLOYMENT AMONG WOMEN WITH CHILDREN UNDER 18 YEARS
29.3/ 100
METRIC RATING
193rd/ 347
METRIC RANK
6.5%
UNEMPLOYMENT AMONG WOMEN WITH CHILDREN UNDER 18 YEARS
0.0/ 100
METRIC RATING
308th/ 347
METRIC RANK
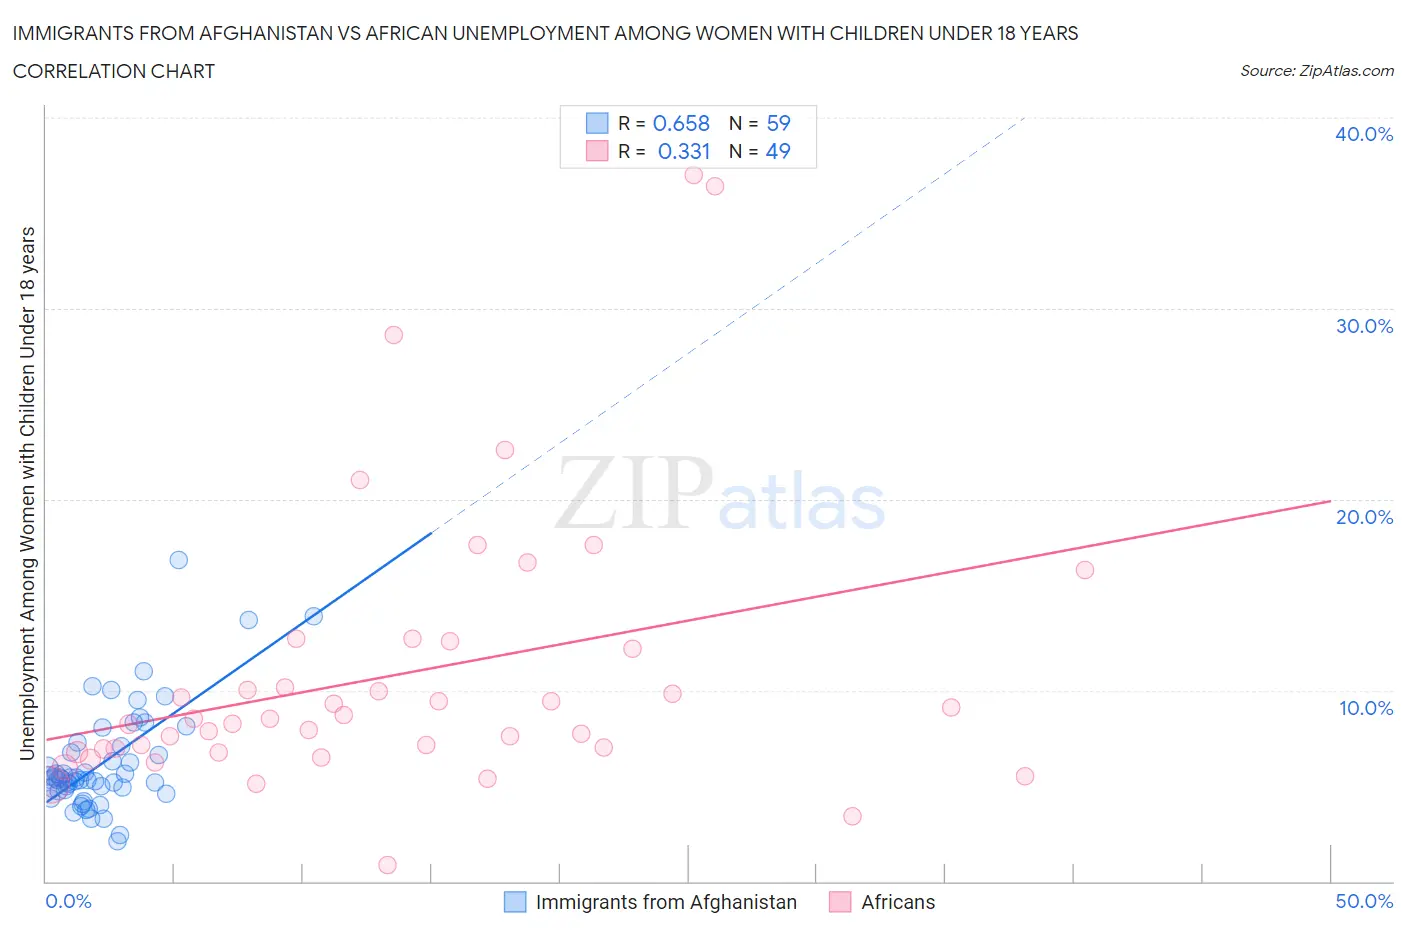
Immigrants from Afghanistan vs African Unemployment Among Women with Children Under 18 years Correlation Chart
The statistical analysis conducted on geographies consisting of 146,289,388 people shows a significant positive correlation between the proportion of Immigrants from Afghanistan and unemployment rate among women with children under the age of 18 in the United States with a correlation coefficient (R) of 0.658 and weighted average of 5.5%. Similarly, the statistical analysis conducted on geographies consisting of 448,423,586 people shows a mild positive correlation between the proportion of Africans and unemployment rate among women with children under the age of 18 in the United States with a correlation coefficient (R) of 0.331 and weighted average of 6.5%, a difference of 18.2%.
Unemployment Among Women with Children Under 18 years Correlation Summary
| Measurement | Immigrants from Afghanistan | African |
| Minimum | 2.1% | 0.83% |
| Maximum | 16.8% | 37.0% |
| Range | 14.7% | 36.2% |
| Mean | 6.2% | 10.8% |
| Median | 5.4% | 8.5% |
| Interquartile 25% (IQ1) | 4.8% | 6.8% |
| Interquartile 75% (IQ3) | 7.1% | 12.4% |
| Interquartile Range (IQR) | 2.3% | 5.6% |
| Standard Deviation (Sample) | 2.8% | 7.4% |
| Standard Deviation (Population) | 2.7% | 7.3% |
Similar Demographics by Unemployment Among Women with Children Under 18 years
Demographics Similar to Immigrants from Afghanistan by Unemployment Among Women with Children Under 18 years
In terms of unemployment among women with children under 18 years, the demographic groups most similar to Immigrants from Afghanistan are Immigrants from Chile (5.5%, a difference of 0.010%), Immigrants from Spain (5.5%, a difference of 0.12%), South American Indian (5.5%, a difference of 0.13%), Immigrants from Poland (5.5%, a difference of 0.16%), and Immigrants from Eritrea (5.5%, a difference of 0.37%).
| Demographics | Rating | Rank | Unemployment Among Women with Children Under 18 years |
| Indonesians | 36.3 /100 | #186 | Fair 5.5% |
| Malaysians | 35.7 /100 | #187 | Fair 5.5% |
| Iraqis | 35.3 /100 | #188 | Fair 5.5% |
| Immigrants | Eritrea | 33.8 /100 | #189 | Fair 5.5% |
| Immigrants | Poland | 31.2 /100 | #190 | Fair 5.5% |
| South American Indians | 30.8 /100 | #191 | Fair 5.5% |
| Immigrants | Spain | 30.7 /100 | #192 | Fair 5.5% |
| Immigrants | Afghanistan | 29.3 /100 | #193 | Fair 5.5% |
| Immigrants | Chile | 29.2 /100 | #194 | Fair 5.5% |
| Colombians | 22.8 /100 | #195 | Fair 5.6% |
| Spaniards | 22.8 /100 | #196 | Fair 5.6% |
| Immigrants | Colombia | 21.4 /100 | #197 | Fair 5.6% |
| Arabs | 21.4 /100 | #198 | Fair 5.6% |
| Marshallese | 20.2 /100 | #199 | Fair 5.6% |
| Menominee | 18.6 /100 | #200 | Poor 5.6% |
Demographics Similar to Africans by Unemployment Among Women with Children Under 18 years
In terms of unemployment among women with children under 18 years, the demographic groups most similar to Africans are Ecuadorian (6.5%, a difference of 0.090%), Belizean (6.5%, a difference of 0.22%), Immigrants from Guyana (6.5%, a difference of 0.29%), Guyanese (6.6%, a difference of 0.33%), and Immigrants from Central America (6.5%, a difference of 0.34%).
| Demographics | Rating | Rank | Unemployment Among Women with Children Under 18 years |
| Immigrants | Haiti | 0.0 /100 | #301 | Tragic 6.4% |
| Immigrants | Armenia | 0.0 /100 | #302 | Tragic 6.5% |
| Immigrants | Honduras | 0.0 /100 | #303 | Tragic 6.5% |
| Vietnamese | 0.0 /100 | #304 | Tragic 6.5% |
| Immigrants | Central America | 0.0 /100 | #305 | Tragic 6.5% |
| Immigrants | Guyana | 0.0 /100 | #306 | Tragic 6.5% |
| Belizeans | 0.0 /100 | #307 | Tragic 6.5% |
| Africans | 0.0 /100 | #308 | Tragic 6.5% |
| Ecuadorians | 0.0 /100 | #309 | Tragic 6.5% |
| Guyanese | 0.0 /100 | #310 | Tragic 6.6% |
| Yaqui | 0.0 /100 | #311 | Tragic 6.6% |
| Immigrants | Mexico | 0.0 /100 | #312 | Tragic 6.6% |
| Hispanics or Latinos | 0.0 /100 | #313 | Tragic 6.6% |
| British West Indians | 0.0 /100 | #314 | Tragic 6.6% |
| Immigrants | West Indies | 0.0 /100 | #315 | Tragic 6.6% |