Native/Alaskan vs Tohono O'odham Unemployment Among Women with Children Under 18 years
COMPARE
Native/Alaskan
Tohono O'odham
Unemployment Among Women with Children Under 18 years
Unemployment Among Women with Children Under 18 years Comparison
Natives/Alaskans
Tohono O'odham
7.2%
UNEMPLOYMENT AMONG WOMEN WITH CHILDREN UNDER 18 YEARS
0.0/ 100
METRIC RATING
328th/ 347
METRIC RANK
8.9%
UNEMPLOYMENT AMONG WOMEN WITH CHILDREN UNDER 18 YEARS
0.0/ 100
METRIC RATING
341st/ 347
METRIC RANK
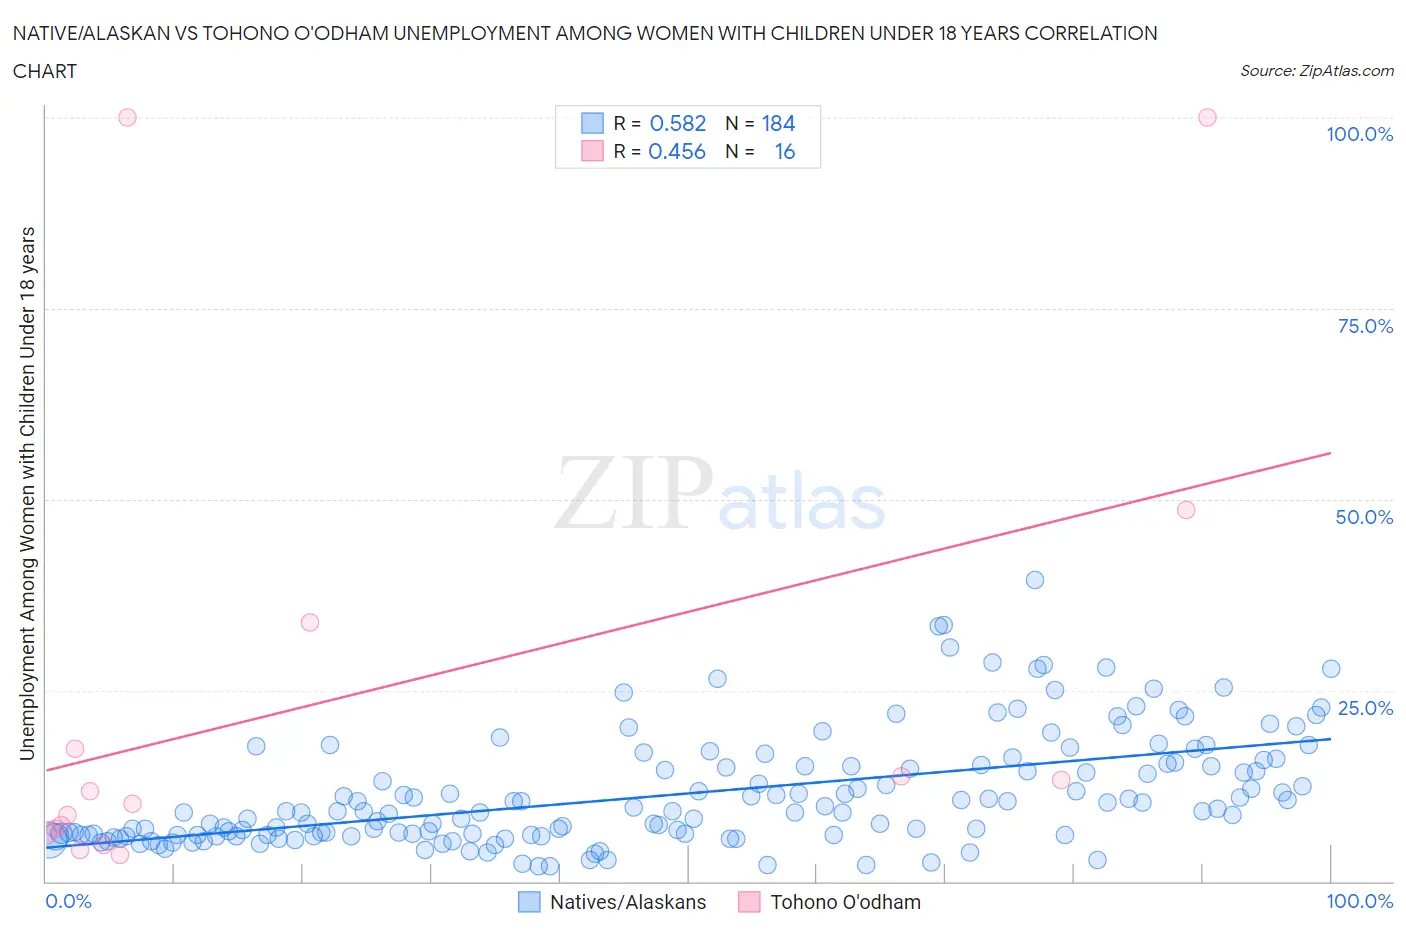
Native/Alaskan vs Tohono O'odham Unemployment Among Women with Children Under 18 years Correlation Chart
The statistical analysis conducted on geographies consisting of 478,925,590 people shows a substantial positive correlation between the proportion of Natives/Alaskans and unemployment rate among women with children under the age of 18 in the United States with a correlation coefficient (R) of 0.582 and weighted average of 7.2%. Similarly, the statistical analysis conducted on geographies consisting of 58,389,482 people shows a moderate positive correlation between the proportion of Tohono O'odham and unemployment rate among women with children under the age of 18 in the United States with a correlation coefficient (R) of 0.456 and weighted average of 8.9%, a difference of 22.2%.
Unemployment Among Women with Children Under 18 years Correlation Summary
| Measurement | Native/Alaskan | Tohono O'odham |
| Minimum | 1.9% | 3.4% |
| Maximum | 39.5% | 100.0% |
| Range | 37.5% | 96.6% |
| Mean | 11.4% | 24.4% |
| Median | 9.1% | 10.9% |
| Interquartile 25% (IQ1) | 6.0% | 6.5% |
| Interquartile 75% (IQ3) | 15.1% | 25.6% |
| Interquartile Range (IQR) | 9.1% | 19.1% |
| Standard Deviation (Sample) | 7.3% | 31.8% |
| Standard Deviation (Population) | 7.3% | 30.8% |
Demographics Similar to Natives/Alaskans and Tohono O'odham by Unemployment Among Women with Children Under 18 years
In terms of unemployment among women with children under 18 years, the demographic groups most similar to Natives/Alaskans are Black/African American (7.3%, a difference of 0.41%), Colville (7.4%, a difference of 1.9%), Lumbee (7.1%, a difference of 2.4%), Hopi (7.4%, a difference of 2.4%), and Dominican (7.5%, a difference of 3.0%). Similarly, the demographic groups most similar to Tohono O'odham are Puerto Rican (9.0%, a difference of 1.7%), Arapaho (9.2%, a difference of 3.8%), Crow (8.2%, a difference of 7.5%), Navajo (8.2%, a difference of 7.7%), and Inupiat (9.6%, a difference of 8.1%).
| Demographics | Rating | Rank | Unemployment Among Women with Children Under 18 years |
| Paiute | 0.0 /100 | #324 | Tragic 6.9% |
| Immigrants | Dominica | 0.0 /100 | #325 | Tragic 7.0% |
| Chippewa | 0.0 /100 | #326 | Tragic 7.0% |
| Lumbee | 0.0 /100 | #327 | Tragic 7.1% |
| Natives/Alaskans | 0.0 /100 | #328 | Tragic 7.2% |
| Blacks/African Americans | 0.0 /100 | #329 | Tragic 7.3% |
| Colville | 0.0 /100 | #330 | Tragic 7.4% |
| Hopi | 0.0 /100 | #331 | Tragic 7.4% |
| Dominicans | 0.0 /100 | #332 | Tragic 7.5% |
| Immigrants | Dominican Republic | 0.0 /100 | #333 | Tragic 7.5% |
| Cheyenne | 0.0 /100 | #334 | Tragic 7.8% |
| Apache | 0.0 /100 | #335 | Tragic 7.9% |
| Sioux | 0.0 /100 | #336 | Tragic 7.9% |
| Yakama | 0.0 /100 | #337 | Tragic 8.1% |
| Immigrants | Yemen | 0.0 /100 | #338 | Tragic 8.2% |
| Navajo | 0.0 /100 | #339 | Tragic 8.2% |
| Crow | 0.0 /100 | #340 | Tragic 8.2% |
| Tohono O'odham | 0.0 /100 | #341 | Tragic 8.9% |
| Puerto Ricans | 0.0 /100 | #342 | Tragic 9.0% |
| Arapaho | 0.0 /100 | #343 | Tragic 9.2% |
| Inupiat | 0.0 /100 | #344 | Tragic 9.6% |