Mexican vs Immigrants from Central America Unemployment
COMPARE
Mexican
Immigrants from Central America
Unemployment
Unemployment Comparison
Mexicans
Immigrants from Central America
5.9%
UNEMPLOYMENT
0.1/ 100
METRIC RATING
271st/ 347
METRIC RANK
6.0%
UNEMPLOYMENT
0.0/ 100
METRIC RATING
276th/ 347
METRIC RANK
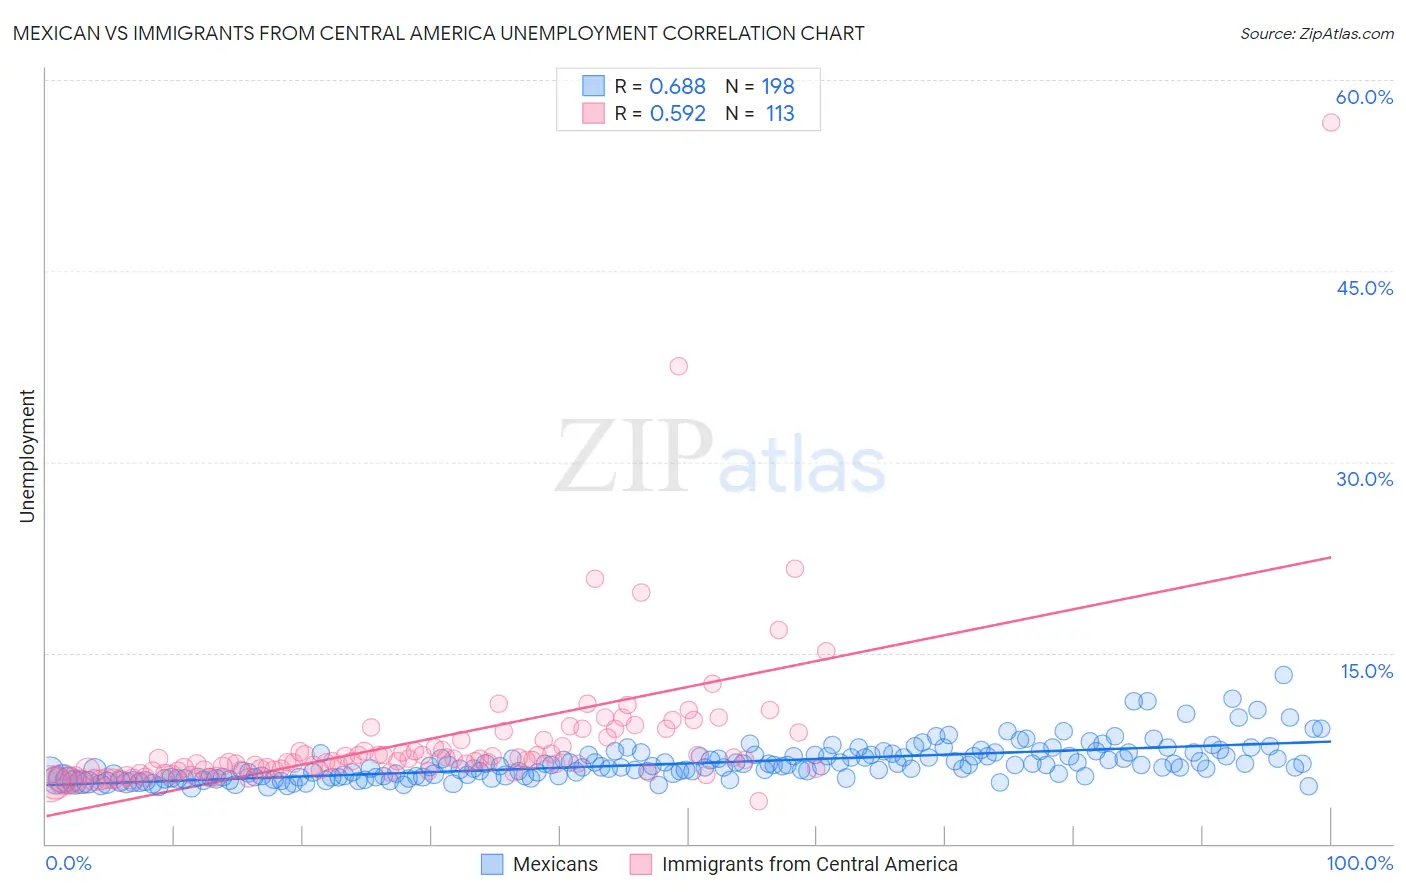
Mexican vs Immigrants from Central America Unemployment Correlation Chart
The statistical analysis conducted on geographies consisting of 561,800,236 people shows a significant positive correlation between the proportion of Mexicans and unemployment in the United States with a correlation coefficient (R) of 0.688 and weighted average of 5.9%. Similarly, the statistical analysis conducted on geographies consisting of 534,368,587 people shows a substantial positive correlation between the proportion of Immigrants from Central America and unemployment in the United States with a correlation coefficient (R) of 0.592 and weighted average of 6.0%, a difference of 1.6%.
Unemployment Correlation Summary
| Measurement | Mexican | Immigrants from Central America |
| Minimum | 4.4% | 3.3% |
| Maximum | 13.3% | 56.6% |
| Range | 8.9% | 53.3% |
| Mean | 6.3% | 8.1% |
| Median | 6.0% | 6.5% |
| Interquartile 25% (IQ1) | 5.2% | 5.7% |
| Interquartile 75% (IQ3) | 6.9% | 8.1% |
| Interquartile Range (IQR) | 1.7% | 2.4% |
| Standard Deviation (Sample) | 1.4% | 6.2% |
| Standard Deviation (Population) | 1.4% | 6.2% |
Demographics Similar to Mexicans and Immigrants from Central America by Unemployment
In terms of unemployment, the demographic groups most similar to Mexicans are Blackfeet (5.8%, a difference of 0.23%), Immigrants from El Salvador (5.8%, a difference of 0.31%), Immigrants from Sierra Leone (5.8%, a difference of 0.32%), Immigrants from Nigeria (5.8%, a difference of 0.36%), and Mexican American Indian (5.8%, a difference of 0.43%). Similarly, the demographic groups most similar to Immigrants from Central America are Immigrants from Latin America (5.9%, a difference of 0.28%), Armenian (6.0%, a difference of 0.35%), Bahamian (5.9%, a difference of 0.49%), Ghanaian (6.0%, a difference of 0.64%), and Immigrants from Fiji (5.9%, a difference of 0.78%).
| Demographics | Rating | Rank | Unemployment |
| Salvadorans | 0.1 /100 | #263 | Tragic 5.8% |
| Immigrants | Liberia | 0.1 /100 | #264 | Tragic 5.8% |
| Nigerians | 0.1 /100 | #265 | Tragic 5.8% |
| Mexican American Indians | 0.1 /100 | #266 | Tragic 5.8% |
| Immigrants | Nigeria | 0.1 /100 | #267 | Tragic 5.8% |
| Immigrants | Sierra Leone | 0.1 /100 | #268 | Tragic 5.8% |
| Immigrants | El Salvador | 0.1 /100 | #269 | Tragic 5.8% |
| Blackfeet | 0.1 /100 | #270 | Tragic 5.8% |
| Mexicans | 0.1 /100 | #271 | Tragic 5.9% |
| Hispanics or Latinos | 0.0 /100 | #272 | Tragic 5.9% |
| Immigrants | Fiji | 0.0 /100 | #273 | Tragic 5.9% |
| Bahamians | 0.0 /100 | #274 | Tragic 5.9% |
| Immigrants | Latin America | 0.0 /100 | #275 | Tragic 5.9% |
| Immigrants | Central America | 0.0 /100 | #276 | Tragic 6.0% |
| Armenians | 0.0 /100 | #277 | Tragic 6.0% |
| Ghanaians | 0.0 /100 | #278 | Tragic 6.0% |
| Immigrants | Mexico | 0.0 /100 | #279 | Tragic 6.0% |
| Immigrants | Western Africa | 0.0 /100 | #280 | Tragic 6.0% |
| Africans | 0.0 /100 | #281 | Tragic 6.1% |
| Immigrants | Azores | 0.0 /100 | #282 | Tragic 6.1% |
| Immigrants | Ghana | 0.0 /100 | #283 | Tragic 6.1% |