Mexican vs Sri Lankan Unemployment
COMPARE
Mexican
Sri Lankan
Unemployment
Unemployment Comparison
Mexicans
Sri Lankans
5.9%
UNEMPLOYMENT
0.1/ 100
METRIC RATING
271st/ 347
METRIC RANK
5.2%
UNEMPLOYMENT
69.5/ 100
METRIC RATING
157th/ 347
METRIC RANK
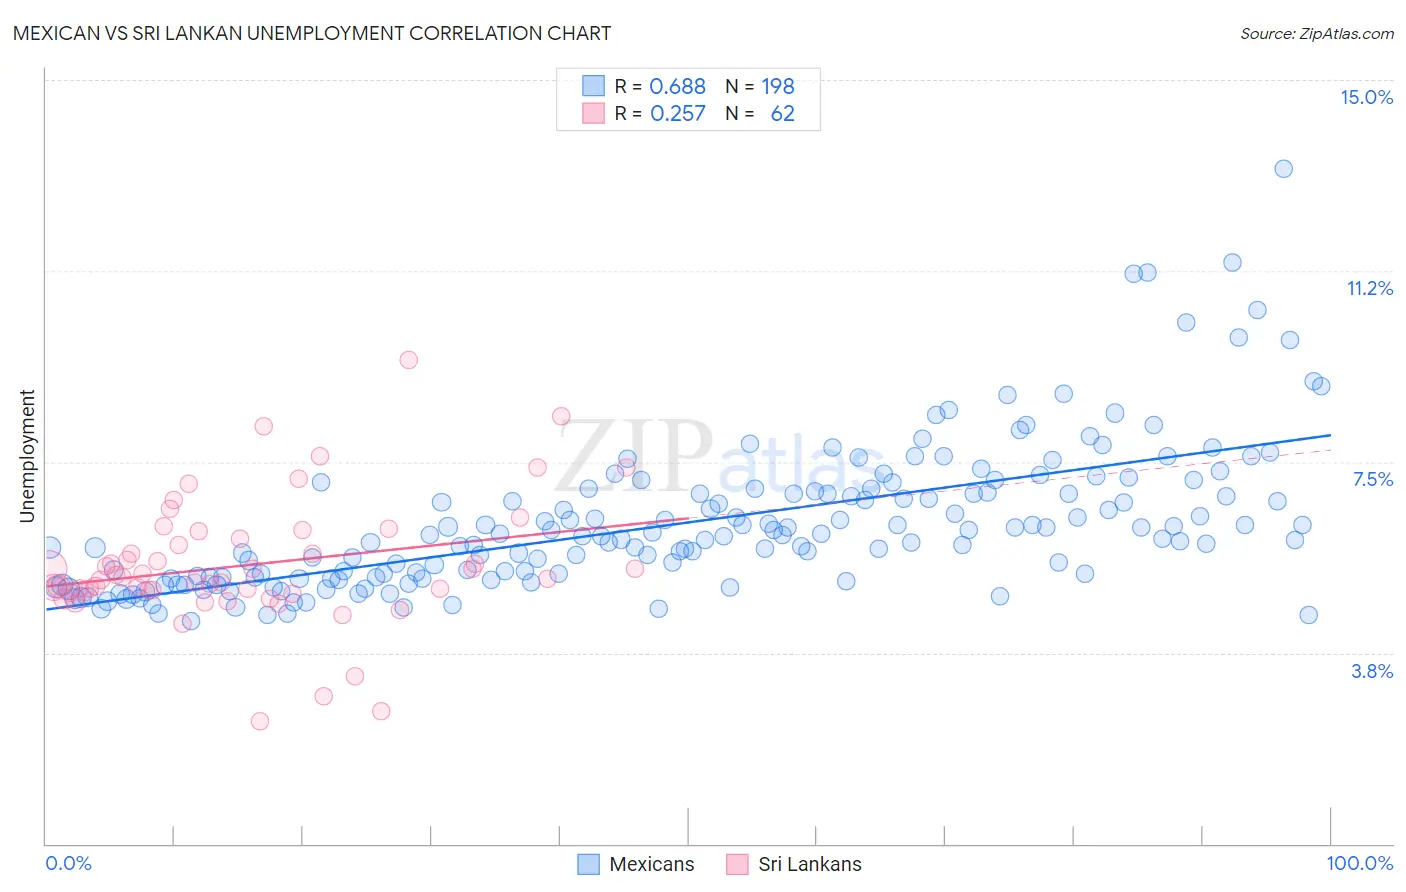
Mexican vs Sri Lankan Unemployment Correlation Chart
The statistical analysis conducted on geographies consisting of 561,800,236 people shows a significant positive correlation between the proportion of Mexicans and unemployment in the United States with a correlation coefficient (R) of 0.688 and weighted average of 5.9%. Similarly, the statistical analysis conducted on geographies consisting of 440,052,205 people shows a weak positive correlation between the proportion of Sri Lankans and unemployment in the United States with a correlation coefficient (R) of 0.257 and weighted average of 5.2%, a difference of 12.9%.
Unemployment Correlation Summary
| Measurement | Mexican | Sri Lankan |
| Minimum | 4.4% | 2.4% |
| Maximum | 13.3% | 9.5% |
| Range | 8.9% | 7.1% |
| Mean | 6.3% | 5.5% |
| Median | 6.0% | 5.2% |
| Interquartile 25% (IQ1) | 5.2% | 5.0% |
| Interquartile 75% (IQ3) | 6.9% | 6.0% |
| Interquartile Range (IQR) | 1.7% | 1.0% |
| Standard Deviation (Sample) | 1.4% | 1.2% |
| Standard Deviation (Population) | 1.4% | 1.2% |
Similar Demographics by Unemployment
Demographics Similar to Mexicans by Unemployment
In terms of unemployment, the demographic groups most similar to Mexicans are Blackfeet (5.8%, a difference of 0.23%), Immigrants from El Salvador (5.8%, a difference of 0.31%), Immigrants from Sierra Leone (5.8%, a difference of 0.32%), Immigrants from Nigeria (5.8%, a difference of 0.36%), and Mexican American Indian (5.8%, a difference of 0.43%).
| Demographics | Rating | Rank | Unemployment |
| Immigrants | Liberia | 0.1 /100 | #264 | Tragic 5.8% |
| Nigerians | 0.1 /100 | #265 | Tragic 5.8% |
| Mexican American Indians | 0.1 /100 | #266 | Tragic 5.8% |
| Immigrants | Nigeria | 0.1 /100 | #267 | Tragic 5.8% |
| Immigrants | Sierra Leone | 0.1 /100 | #268 | Tragic 5.8% |
| Immigrants | El Salvador | 0.1 /100 | #269 | Tragic 5.8% |
| Blackfeet | 0.1 /100 | #270 | Tragic 5.8% |
| Mexicans | 0.1 /100 | #271 | Tragic 5.9% |
| Hispanics or Latinos | 0.0 /100 | #272 | Tragic 5.9% |
| Immigrants | Fiji | 0.0 /100 | #273 | Tragic 5.9% |
| Bahamians | 0.0 /100 | #274 | Tragic 5.9% |
| Immigrants | Latin America | 0.0 /100 | #275 | Tragic 5.9% |
| Immigrants | Central America | 0.0 /100 | #276 | Tragic 6.0% |
| Armenians | 0.0 /100 | #277 | Tragic 6.0% |
| Ghanaians | 0.0 /100 | #278 | Tragic 6.0% |
Demographics Similar to Sri Lankans by Unemployment
In terms of unemployment, the demographic groups most similar to Sri Lankans are Immigrants from Kazakhstan (5.2%, a difference of 0.060%), Immigrants from Northern Africa (5.2%, a difference of 0.13%), Immigrants from Egypt (5.2%, a difference of 0.20%), Immigrants from Russia (5.2%, a difference of 0.20%), and Laotian (5.2%, a difference of 0.23%).
| Demographics | Rating | Rank | Unemployment |
| Potawatomi | 76.2 /100 | #150 | Good 5.2% |
| Immigrants | Eastern Europe | 75.3 /100 | #151 | Good 5.2% |
| Immigrants | Hong Kong | 75.2 /100 | #152 | Good 5.2% |
| Egyptians | 75.2 /100 | #153 | Good 5.2% |
| Immigrants | China | 74.7 /100 | #154 | Good 5.2% |
| Immigrants | Northern Africa | 71.3 /100 | #155 | Good 5.2% |
| Immigrants | Kazakhstan | 70.4 /100 | #156 | Good 5.2% |
| Sri Lankans | 69.5 /100 | #157 | Good 5.2% |
| Immigrants | Egypt | 66.7 /100 | #158 | Good 5.2% |
| Immigrants | Russia | 66.6 /100 | #159 | Good 5.2% |
| Laotians | 66.3 /100 | #160 | Good 5.2% |
| Immigrants | Oceania | 65.2 /100 | #161 | Good 5.2% |
| Spanish | 65.1 /100 | #162 | Good 5.2% |
| Immigrants | Zaire | 64.7 /100 | #163 | Good 5.2% |
| Immigrants | Colombia | 64.7 /100 | #164 | Good 5.2% |