Menominee vs West Indian Unemployment Among Women with Children Ages 6 to 17 years
COMPARE
Menominee
West Indian
Unemployment Among Women with Children Ages 6 to 17 years
Unemployment Among Women with Children Ages 6 to 17 years Comparison
Menominee
West Indians
9.0%
UNEMPLOYMENT AMONG WOMEN WITH CHILDREN AGES 6 TO 17 YEARS
39.3/ 100
METRIC RATING
178th/ 347
METRIC RANK
9.5%
UNEMPLOYMENT AMONG WOMEN WITH CHILDREN AGES 6 TO 17 YEARS
0.4/ 100
METRIC RATING
265th/ 347
METRIC RANK
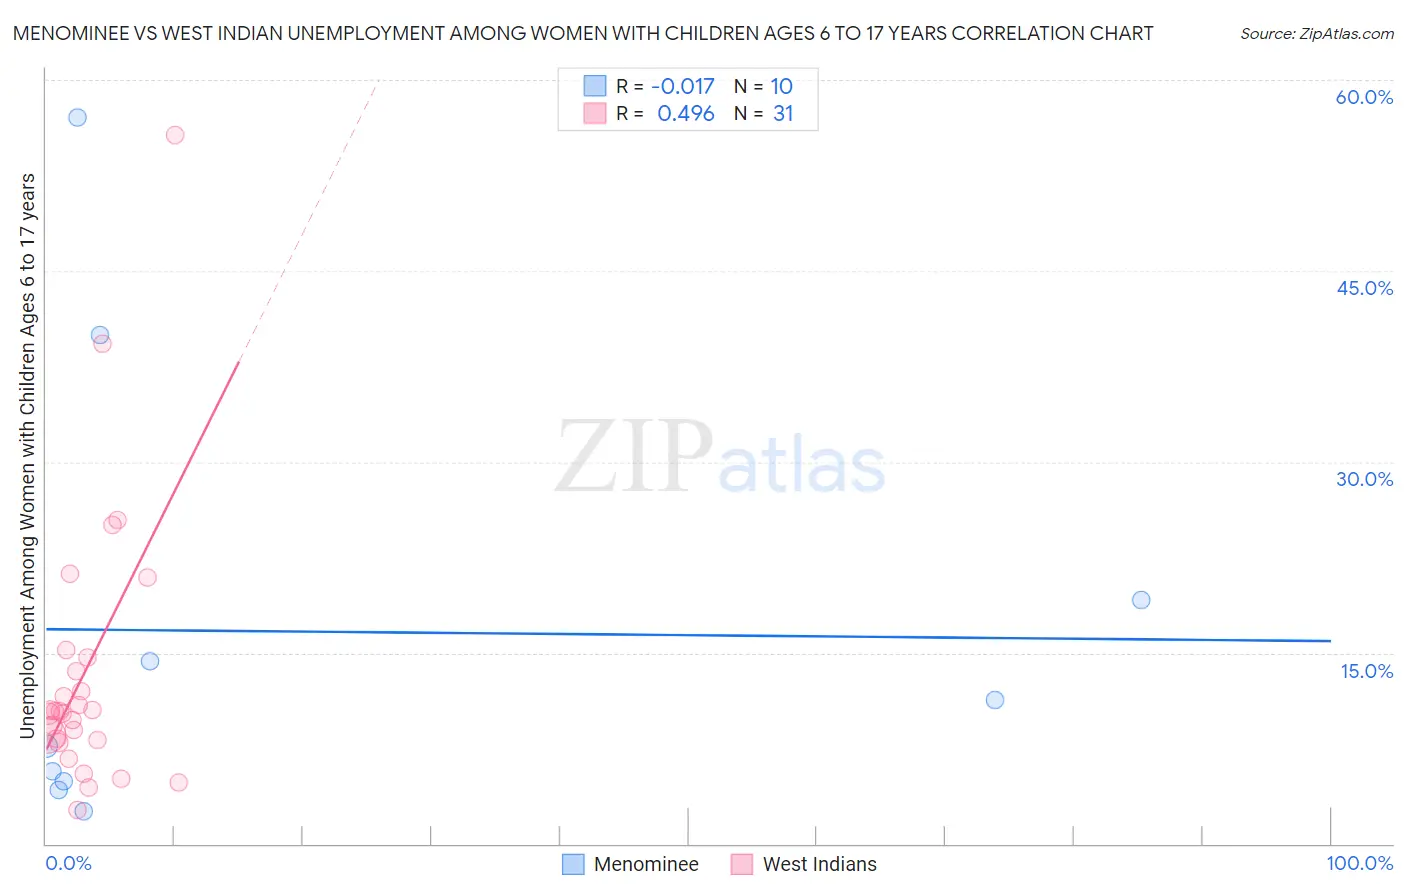
Menominee vs West Indian Unemployment Among Women with Children Ages 6 to 17 years Correlation Chart
The statistical analysis conducted on geographies consisting of 40,123,903 people shows no correlation between the proportion of Menominee and unemployment rate among women with children between the ages 6 and 17 in the United States with a correlation coefficient (R) of -0.017 and weighted average of 9.0%. Similarly, the statistical analysis conducted on geographies consisting of 202,380,945 people shows a moderate positive correlation between the proportion of West Indians and unemployment rate among women with children between the ages 6 and 17 in the United States with a correlation coefficient (R) of 0.496 and weighted average of 9.5%, a difference of 5.7%.
Unemployment Among Women with Children Ages 6 to 17 years Correlation Summary
| Measurement | Menominee | West Indian |
| Minimum | 2.6% | 2.7% |
| Maximum | 57.1% | 55.7% |
| Range | 54.5% | 53.0% |
| Mean | 16.7% | 13.5% |
| Median | 9.5% | 10.4% |
| Interquartile 25% (IQ1) | 4.9% | 8.2% |
| Interquartile 75% (IQ3) | 19.1% | 14.6% |
| Interquartile Range (IQR) | 14.2% | 6.4% |
| Standard Deviation (Sample) | 18.0% | 10.8% |
| Standard Deviation (Population) | 17.1% | 10.7% |
Similar Demographics by Unemployment Among Women with Children Ages 6 to 17 years
Demographics Similar to Menominee by Unemployment Among Women with Children Ages 6 to 17 years
In terms of unemployment among women with children ages 6 to 17 years, the demographic groups most similar to Menominee are Immigrants from Zaire (9.0%, a difference of 0.040%), Ethiopian (9.0%, a difference of 0.080%), Immigrants from Jordan (9.0%, a difference of 0.11%), Immigrants from Italy (9.0%, a difference of 0.20%), and Immigrants from Czechoslovakia (9.0%, a difference of 0.23%).
| Demographics | Rating | Rank | Unemployment Among Women with Children Ages 6 to 17 years |
| Jordanians | 52.2 /100 | #171 | Average 9.0% |
| Immigrants | West Indies | 52.2 /100 | #172 | Average 9.0% |
| Immigrants | Brazil | 51.0 /100 | #173 | Average 9.0% |
| Immigrants | Costa Rica | 50.0 /100 | #174 | Average 9.0% |
| Immigrants | Sierra Leone | 45.9 /100 | #175 | Average 9.0% |
| Immigrants | Italy | 43.7 /100 | #176 | Average 9.0% |
| Immigrants | Jordan | 41.6 /100 | #177 | Average 9.0% |
| Menominee | 39.3 /100 | #178 | Fair 9.0% |
| Immigrants | Zaire | 38.3 /100 | #179 | Fair 9.0% |
| Ethiopians | 37.6 /100 | #180 | Fair 9.0% |
| Immigrants | Czechoslovakia | 34.5 /100 | #181 | Fair 9.0% |
| South American Indians | 34.4 /100 | #182 | Fair 9.0% |
| Swiss | 33.5 /100 | #183 | Fair 9.0% |
| Palestinians | 33.4 /100 | #184 | Fair 9.0% |
| Immigrants | Congo | 32.5 /100 | #185 | Fair 9.0% |
Demographics Similar to West Indians by Unemployment Among Women with Children Ages 6 to 17 years
In terms of unemployment among women with children ages 6 to 17 years, the demographic groups most similar to West Indians are Immigrants from Ghana (9.5%, a difference of 0.030%), Immigrants from Jamaica (9.5%, a difference of 0.16%), Irish (9.5%, a difference of 0.18%), Lebanese (9.5%, a difference of 0.27%), and Senegalese (9.5%, a difference of 0.31%).
| Demographics | Rating | Rank | Unemployment Among Women with Children Ages 6 to 17 years |
| Immigrants | Mexico | 0.7 /100 | #258 | Tragic 9.5% |
| Immigrants | Central America | 0.6 /100 | #259 | Tragic 9.5% |
| Italians | 0.6 /100 | #260 | Tragic 9.5% |
| South Americans | 0.5 /100 | #261 | Tragic 9.5% |
| Senegalese | 0.5 /100 | #262 | Tragic 9.5% |
| Lebanese | 0.5 /100 | #263 | Tragic 9.5% |
| Immigrants | Ghana | 0.4 /100 | #264 | Tragic 9.5% |
| West Indians | 0.4 /100 | #265 | Tragic 9.5% |
| Immigrants | Jamaica | 0.3 /100 | #266 | Tragic 9.5% |
| Irish | 0.3 /100 | #267 | Tragic 9.5% |
| Ghanaians | 0.2 /100 | #268 | Tragic 9.6% |
| Blackfeet | 0.2 /100 | #269 | Tragic 9.6% |
| Immigrants | Nicaragua | 0.2 /100 | #270 | Tragic 9.6% |
| Immigrants | Latin America | 0.1 /100 | #271 | Tragic 9.6% |
| Kiowa | 0.1 /100 | #272 | Tragic 9.6% |