Menominee vs Liberian Unemployment Among Women with Children Ages 6 to 17 years
COMPARE
Menominee
Liberian
Unemployment Among Women with Children Ages 6 to 17 years
Unemployment Among Women with Children Ages 6 to 17 years Comparison
Menominee
Liberians
9.0%
UNEMPLOYMENT AMONG WOMEN WITH CHILDREN AGES 6 TO 17 YEARS
39.3/ 100
METRIC RATING
178th/ 347
METRIC RANK
10.8%
UNEMPLOYMENT AMONG WOMEN WITH CHILDREN AGES 6 TO 17 YEARS
0.0/ 100
METRIC RATING
326th/ 347
METRIC RANK
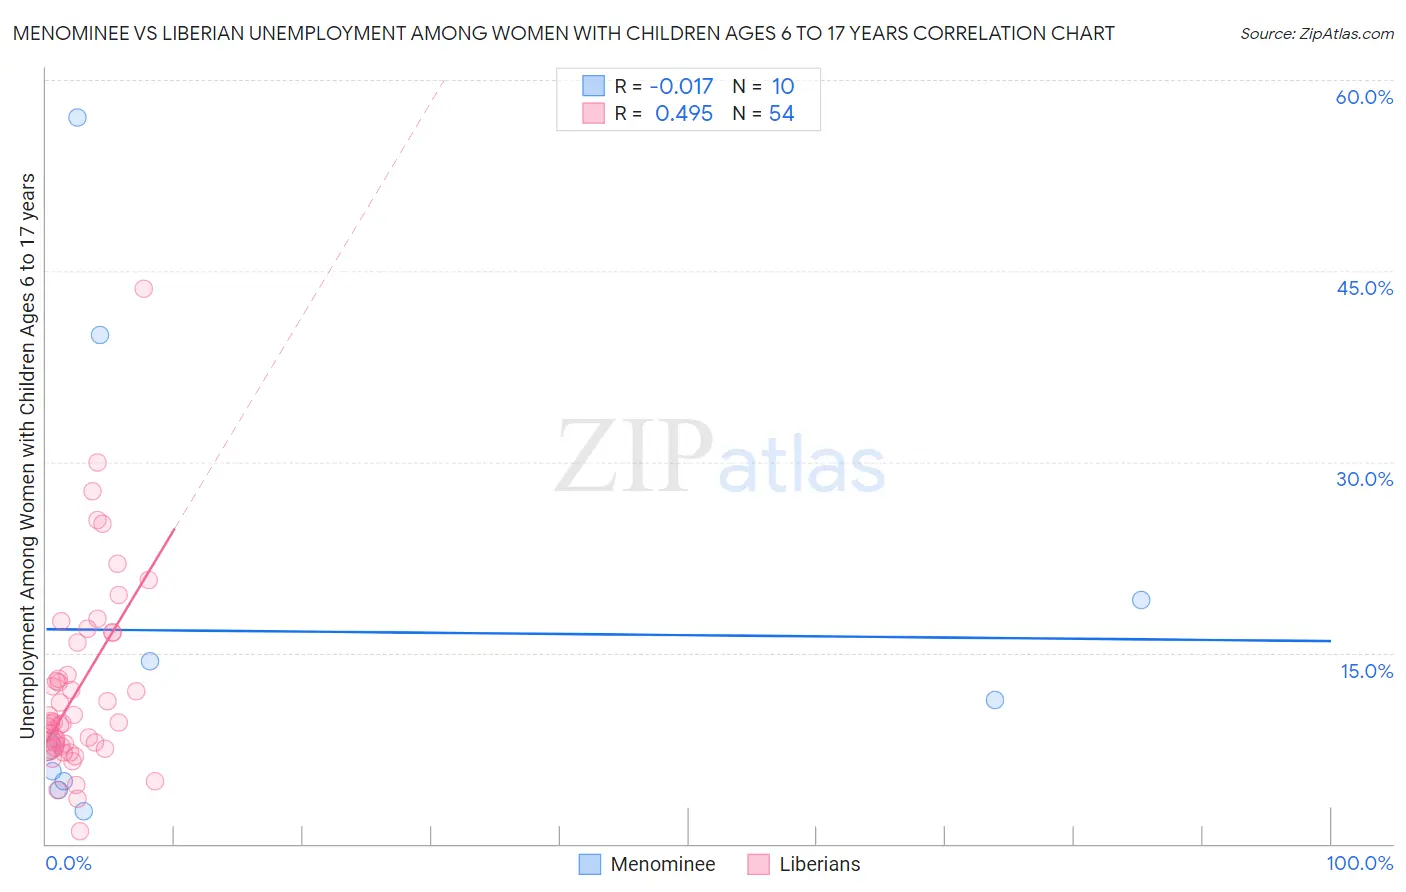
Menominee vs Liberian Unemployment Among Women with Children Ages 6 to 17 years Correlation Chart
The statistical analysis conducted on geographies consisting of 40,123,903 people shows no correlation between the proportion of Menominee and unemployment rate among women with children between the ages 6 and 17 in the United States with a correlation coefficient (R) of -0.017 and weighted average of 9.0%. Similarly, the statistical analysis conducted on geographies consisting of 103,141,134 people shows a moderate positive correlation between the proportion of Liberians and unemployment rate among women with children between the ages 6 and 17 in the United States with a correlation coefficient (R) of 0.495 and weighted average of 10.8%, a difference of 20.4%.
Unemployment Among Women with Children Ages 6 to 17 years Correlation Summary
| Measurement | Menominee | Liberian |
| Minimum | 2.6% | 1.0% |
| Maximum | 57.1% | 43.6% |
| Range | 54.5% | 42.6% |
| Mean | 16.7% | 12.2% |
| Median | 9.5% | 9.5% |
| Interquartile 25% (IQ1) | 4.9% | 7.7% |
| Interquartile 75% (IQ3) | 19.1% | 15.8% |
| Interquartile Range (IQR) | 14.2% | 8.1% |
| Standard Deviation (Sample) | 18.0% | 7.6% |
| Standard Deviation (Population) | 17.1% | 7.5% |
Similar Demographics by Unemployment Among Women with Children Ages 6 to 17 years
Demographics Similar to Menominee by Unemployment Among Women with Children Ages 6 to 17 years
In terms of unemployment among women with children ages 6 to 17 years, the demographic groups most similar to Menominee are Immigrants from Zaire (9.0%, a difference of 0.040%), Ethiopian (9.0%, a difference of 0.080%), Immigrants from Jordan (9.0%, a difference of 0.11%), Immigrants from Italy (9.0%, a difference of 0.20%), and Immigrants from Czechoslovakia (9.0%, a difference of 0.23%).
| Demographics | Rating | Rank | Unemployment Among Women with Children Ages 6 to 17 years |
| Jordanians | 52.2 /100 | #171 | Average 9.0% |
| Immigrants | West Indies | 52.2 /100 | #172 | Average 9.0% |
| Immigrants | Brazil | 51.0 /100 | #173 | Average 9.0% |
| Immigrants | Costa Rica | 50.0 /100 | #174 | Average 9.0% |
| Immigrants | Sierra Leone | 45.9 /100 | #175 | Average 9.0% |
| Immigrants | Italy | 43.7 /100 | #176 | Average 9.0% |
| Immigrants | Jordan | 41.6 /100 | #177 | Average 9.0% |
| Menominee | 39.3 /100 | #178 | Fair 9.0% |
| Immigrants | Zaire | 38.3 /100 | #179 | Fair 9.0% |
| Ethiopians | 37.6 /100 | #180 | Fair 9.0% |
| Immigrants | Czechoslovakia | 34.5 /100 | #181 | Fair 9.0% |
| South American Indians | 34.4 /100 | #182 | Fair 9.0% |
| Swiss | 33.5 /100 | #183 | Fair 9.0% |
| Palestinians | 33.4 /100 | #184 | Fair 9.0% |
| Immigrants | Congo | 32.5 /100 | #185 | Fair 9.0% |
Demographics Similar to Liberians by Unemployment Among Women with Children Ages 6 to 17 years
In terms of unemployment among women with children ages 6 to 17 years, the demographic groups most similar to Liberians are Cajun (10.8%, a difference of 0.070%), Cape Verdean (10.9%, a difference of 0.070%), Ottawa (10.9%, a difference of 0.20%), Immigrants from Dominican Republic (10.8%, a difference of 0.25%), and Dominican (10.8%, a difference of 0.31%).
| Demographics | Rating | Rank | Unemployment Among Women with Children Ages 6 to 17 years |
| Immigrants | Uganda | 0.0 /100 | #319 | Tragic 10.7% |
| Apache | 0.0 /100 | #320 | Tragic 10.7% |
| Tohono O'odham | 0.0 /100 | #321 | Tragic 10.7% |
| Cree | 0.0 /100 | #322 | Tragic 10.8% |
| Dominicans | 0.0 /100 | #323 | Tragic 10.8% |
| Immigrants | Dominican Republic | 0.0 /100 | #324 | Tragic 10.8% |
| Cajuns | 0.0 /100 | #325 | Tragic 10.8% |
| Liberians | 0.0 /100 | #326 | Tragic 10.8% |
| Cape Verdeans | 0.0 /100 | #327 | Tragic 10.9% |
| Ottawa | 0.0 /100 | #328 | Tragic 10.9% |
| Pennsylvania Germans | 0.0 /100 | #329 | Tragic 11.0% |
| Chippewa | 0.0 /100 | #330 | Tragic 11.1% |
| Blacks/African Americans | 0.0 /100 | #331 | Tragic 11.4% |
| Tsimshian | 0.0 /100 | #332 | Tragic 11.4% |
| Natives/Alaskans | 0.0 /100 | #333 | Tragic 11.5% |