Finnish vs Immigrants from Afghanistan Unemployment Among Women with Children Ages 6 to 17 years
COMPARE
Finnish
Immigrants from Afghanistan
Unemployment Among Women with Children Ages 6 to 17 years
Unemployment Among Women with Children Ages 6 to 17 years Comparison
Finns
Immigrants from Afghanistan
9.2%
UNEMPLOYMENT AMONG WOMEN WITH CHILDREN AGES 6 TO 17 YEARS
10.0/ 100
METRIC RATING
210th/ 347
METRIC RANK
7.8%
UNEMPLOYMENT AMONG WOMEN WITH CHILDREN AGES 6 TO 17 YEARS
100.0/ 100
METRIC RATING
27th/ 347
METRIC RANK
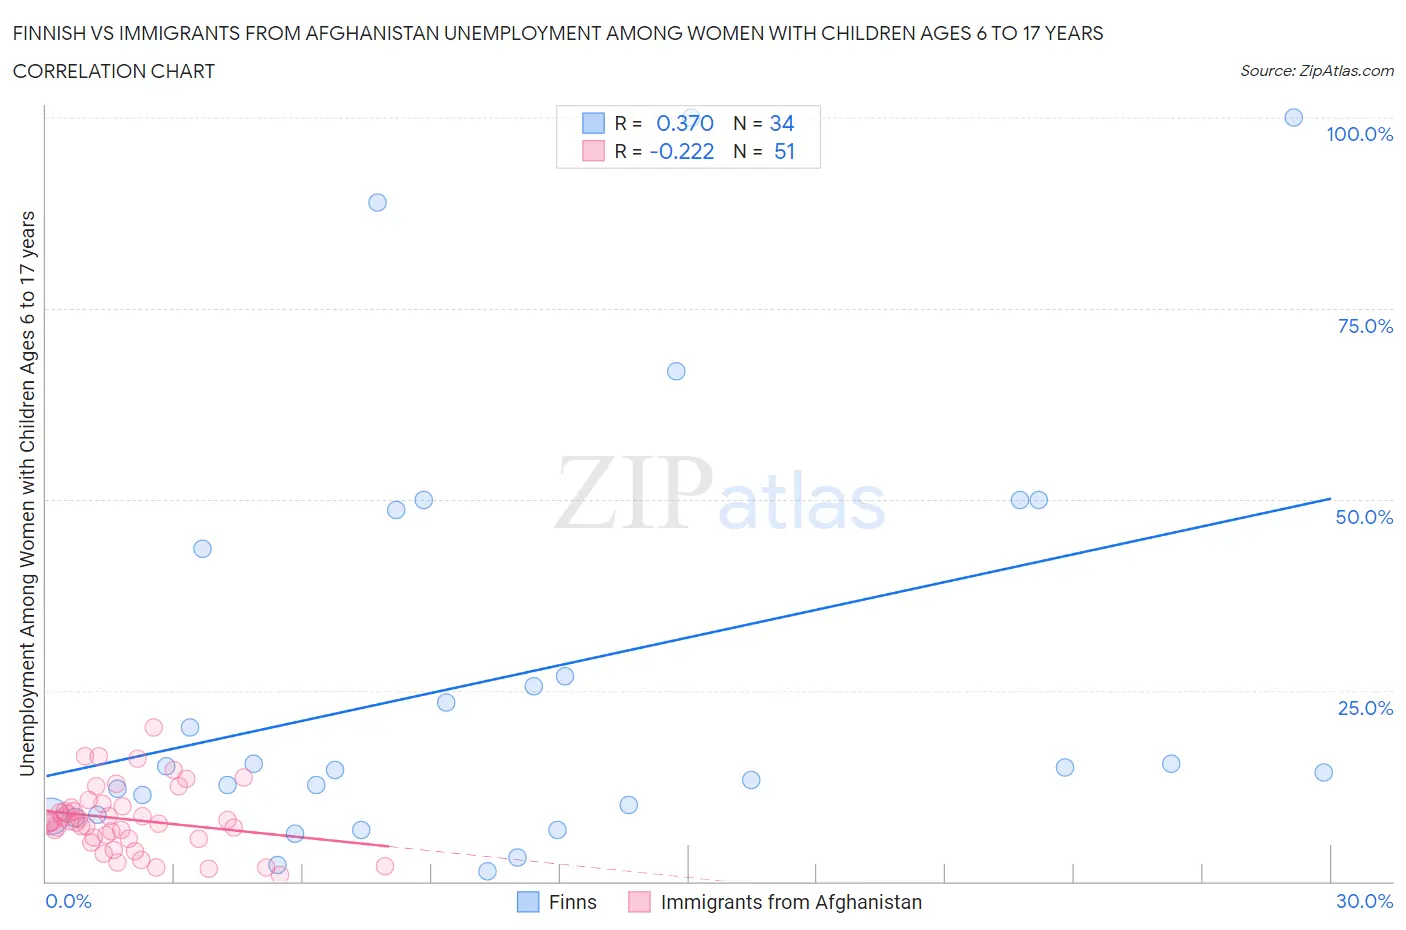
Finnish vs Immigrants from Afghanistan Unemployment Among Women with Children Ages 6 to 17 years Correlation Chart
The statistical analysis conducted on geographies consisting of 277,451,978 people shows a mild positive correlation between the proportion of Finns and unemployment rate among women with children between the ages 6 and 17 in the United States with a correlation coefficient (R) of 0.370 and weighted average of 9.2%. Similarly, the statistical analysis conducted on geographies consisting of 127,539,801 people shows a weak negative correlation between the proportion of Immigrants from Afghanistan and unemployment rate among women with children between the ages 6 and 17 in the United States with a correlation coefficient (R) of -0.222 and weighted average of 7.8%, a difference of 18.1%.
Unemployment Among Women with Children Ages 6 to 17 years Correlation Summary
| Measurement | Finnish | Immigrants from Afghanistan |
| Minimum | 1.3% | 0.80% |
| Maximum | 100.0% | 20.1% |
| Range | 98.7% | 19.3% |
| Mean | 26.7% | 8.1% |
| Median | 14.7% | 7.7% |
| Interquartile 25% (IQ1) | 8.6% | 5.6% |
| Interquartile 75% (IQ3) | 43.5% | 9.9% |
| Interquartile Range (IQR) | 34.9% | 4.3% |
| Standard Deviation (Sample) | 27.4% | 4.2% |
| Standard Deviation (Population) | 27.0% | 4.2% |
Similar Demographics by Unemployment Among Women with Children Ages 6 to 17 years
Demographics Similar to Finns by Unemployment Among Women with Children Ages 6 to 17 years
In terms of unemployment among women with children ages 6 to 17 years, the demographic groups most similar to Finns are Immigrants from Cuba (9.2%, a difference of 0.050%), Salvadoran (9.2%, a difference of 0.090%), Cuban (9.2%, a difference of 0.10%), Immigrants from Peru (9.2%, a difference of 0.10%), and Peruvian (9.2%, a difference of 0.13%).
| Demographics | Rating | Rank | Unemployment Among Women with Children Ages 6 to 17 years |
| Maltese | 15.3 /100 | #203 | Poor 9.1% |
| Immigrants | Canada | 15.3 /100 | #204 | Poor 9.1% |
| Immigrants | Western Europe | 14.1 /100 | #205 | Poor 9.1% |
| Immigrants | North America | 12.7 /100 | #206 | Poor 9.2% |
| Cubans | 10.9 /100 | #207 | Poor 9.2% |
| Immigrants | Peru | 10.8 /100 | #208 | Poor 9.2% |
| Salvadorans | 10.7 /100 | #209 | Poor 9.2% |
| Finns | 10.0 /100 | #210 | Tragic 9.2% |
| Immigrants | Cuba | 9.6 /100 | #211 | Tragic 9.2% |
| Peruvians | 9.0 /100 | #212 | Tragic 9.2% |
| Spaniards | 8.2 /100 | #213 | Tragic 9.2% |
| Iroquois | 7.5 /100 | #214 | Tragic 9.2% |
| Immigrants | Germany | 7.2 /100 | #215 | Tragic 9.2% |
| Immigrants | Uruguay | 7.2 /100 | #216 | Tragic 9.2% |
| Germans | 7.2 /100 | #217 | Tragic 9.2% |
Demographics Similar to Immigrants from Afghanistan by Unemployment Among Women with Children Ages 6 to 17 years
In terms of unemployment among women with children ages 6 to 17 years, the demographic groups most similar to Immigrants from Afghanistan are Immigrants from Uzbekistan (7.8%, a difference of 0.33%), Immigrants from Eastern Asia (7.7%, a difference of 0.63%), Indian (Asian) (7.7%, a difference of 0.63%), Thai (7.8%, a difference of 0.67%), and Immigrants from Indonesia (7.7%, a difference of 0.76%).
| Demographics | Rating | Rank | Unemployment Among Women with Children Ages 6 to 17 years |
| Immigrants | Singapore | 100.0 /100 | #20 | Exceptional 7.7% |
| Immigrants | India | 100.0 /100 | #21 | Exceptional 7.7% |
| Immigrants | China | 100.0 /100 | #22 | Exceptional 7.7% |
| Immigrants | Indonesia | 100.0 /100 | #23 | Exceptional 7.7% |
| Nepalese | 100.0 /100 | #24 | Exceptional 7.7% |
| Immigrants | Eastern Asia | 100.0 /100 | #25 | Exceptional 7.7% |
| Indians (Asian) | 100.0 /100 | #26 | Exceptional 7.7% |
| Immigrants | Afghanistan | 100.0 /100 | #27 | Exceptional 7.8% |
| Immigrants | Uzbekistan | 100.0 /100 | #28 | Exceptional 7.8% |
| Thais | 100.0 /100 | #29 | Exceptional 7.8% |
| Immigrants | Iran | 100.0 /100 | #30 | Exceptional 7.9% |
| Laotians | 100.0 /100 | #31 | Exceptional 7.9% |
| Immigrants | Cambodia | 100.0 /100 | #32 | Exceptional 7.9% |
| Immigrants | Korea | 100.0 /100 | #33 | Exceptional 7.9% |
| Native Hawaiians | 100.0 /100 | #34 | Exceptional 7.9% |