Marshallese vs White/Caucasian Unemployment Among Women with Children Under 6 years
COMPARE
Marshallese
White/Caucasian
Unemployment Among Women with Children Under 6 years
Unemployment Among Women with Children Under 6 years Comparison
Marshallese
Whites/Caucasians
9.6%
UNEMPLOYMENT AMONG WOMEN WITH CHILDREN UNDER 6 YEARS
0.0/ 100
METRIC RATING
319th/ 347
METRIC RANK
8.4%
UNEMPLOYMENT AMONG WOMEN WITH CHILDREN UNDER 6 YEARS
0.3/ 100
METRIC RATING
260th/ 347
METRIC RANK
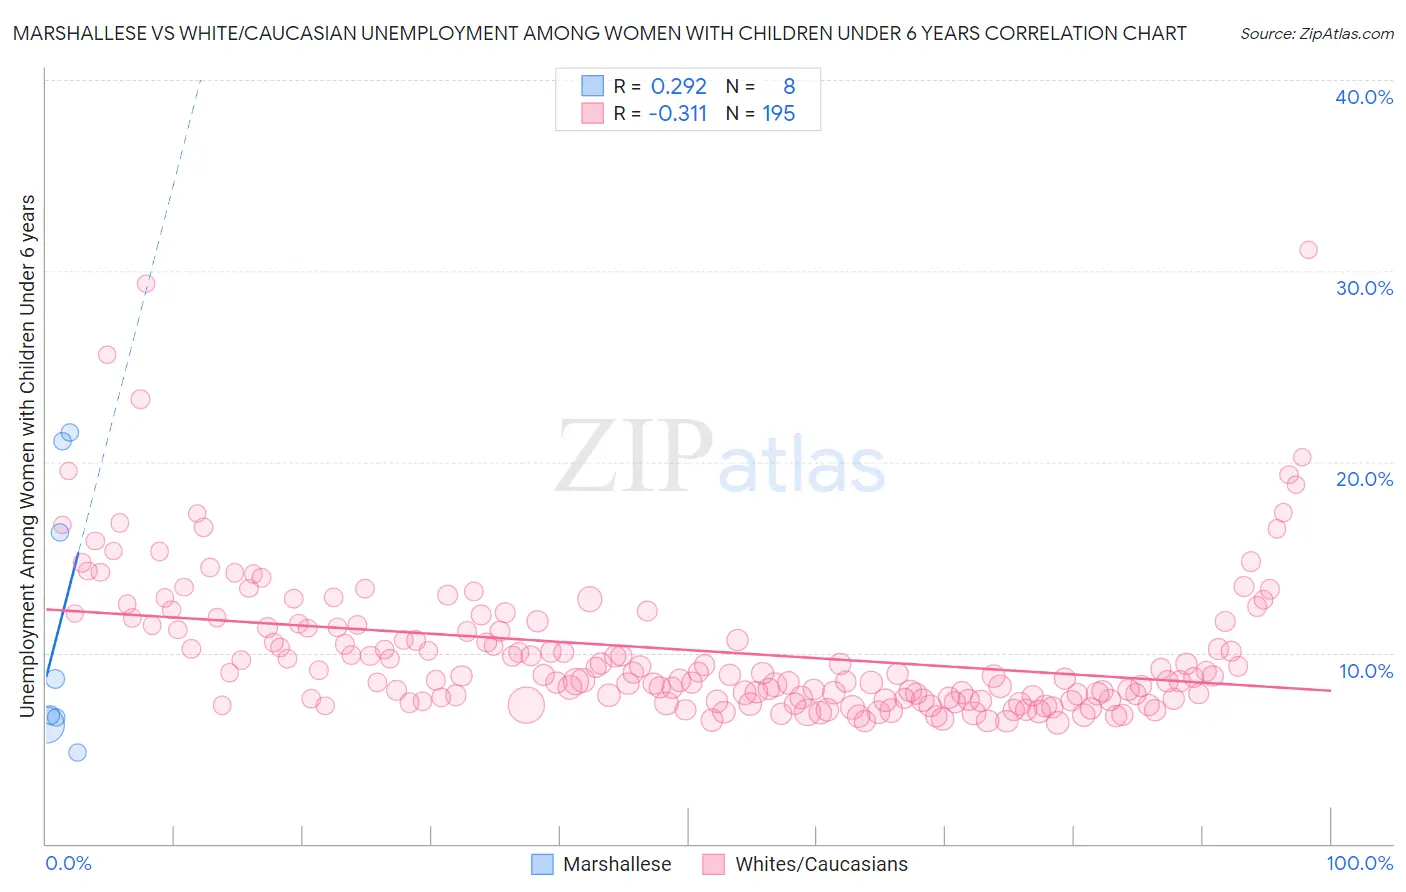
Marshallese vs White/Caucasian Unemployment Among Women with Children Under 6 years Correlation Chart
The statistical analysis conducted on geographies consisting of 13,939,476 people shows a weak positive correlation between the proportion of Marshallese and unemployment rate among women with children under the age of 6 in the United States with a correlation coefficient (R) of 0.292 and weighted average of 9.6%. Similarly, the statistical analysis conducted on geographies consisting of 381,009,459 people shows a mild negative correlation between the proportion of Whites/Caucasians and unemployment rate among women with children under the age of 6 in the United States with a correlation coefficient (R) of -0.311 and weighted average of 8.4%, a difference of 14.5%.
Unemployment Among Women with Children Under 6 years Correlation Summary
| Measurement | Marshallese | White/Caucasian |
| Minimum | 4.8% | 6.3% |
| Maximum | 21.5% | 31.1% |
| Range | 16.7% | 24.8% |
| Mean | 11.5% | 10.2% |
| Median | 7.7% | 8.9% |
| Interquartile 25% (IQ1) | 6.4% | 7.6% |
| Interquartile 75% (IQ3) | 18.7% | 11.5% |
| Interquartile Range (IQR) | 12.3% | 3.9% |
| Standard Deviation (Sample) | 7.0% | 3.9% |
| Standard Deviation (Population) | 6.6% | 3.9% |
Similar Demographics by Unemployment Among Women with Children Under 6 years
Demographics Similar to Marshallese by Unemployment Among Women with Children Under 6 years
In terms of unemployment among women with children under 6 years, the demographic groups most similar to Marshallese are Potawatomi (9.6%, a difference of 0.050%), Central American Indian (9.6%, a difference of 0.11%), Alaska Native (9.6%, a difference of 0.36%), Immigrants from Bahamas (9.6%, a difference of 0.55%), and Osage (9.5%, a difference of 1.0%).
| Demographics | Rating | Rank | Unemployment Among Women with Children Under 6 years |
| Immigrants | Azores | 0.0 /100 | #312 | Tragic 9.2% |
| Americans | 0.0 /100 | #313 | Tragic 9.3% |
| Fijians | 0.0 /100 | #314 | Tragic 9.3% |
| Cherokee | 0.0 /100 | #315 | Tragic 9.3% |
| Houma | 0.0 /100 | #316 | Tragic 9.4% |
| Dutch West Indians | 0.0 /100 | #317 | Tragic 9.5% |
| Osage | 0.0 /100 | #318 | Tragic 9.5% |
| Marshallese | 0.0 /100 | #319 | Tragic 9.6% |
| Potawatomi | 0.0 /100 | #320 | Tragic 9.6% |
| Central American Indians | 0.0 /100 | #321 | Tragic 9.6% |
| Alaska Natives | 0.0 /100 | #322 | Tragic 9.6% |
| Immigrants | Bahamas | 0.0 /100 | #323 | Tragic 9.6% |
| Paiute | 0.0 /100 | #324 | Tragic 9.7% |
| Choctaw | 0.0 /100 | #325 | Tragic 9.8% |
| Delaware | 0.0 /100 | #326 | Tragic 9.8% |
Demographics Similar to Whites/Caucasians by Unemployment Among Women with Children Under 6 years
In terms of unemployment among women with children under 6 years, the demographic groups most similar to Whites/Caucasians are Barbadian (8.3%, a difference of 0.26%), Immigrants from Liberia (8.4%, a difference of 0.28%), West Indian (8.4%, a difference of 0.29%), Scotch-Irish (8.4%, a difference of 0.32%), and Honduran (8.4%, a difference of 0.35%).
| Demographics | Rating | Rank | Unemployment Among Women with Children Under 6 years |
| Immigrants | Guyana | 0.8 /100 | #253 | Tragic 8.2% |
| Immigrants | Caribbean | 0.7 /100 | #254 | Tragic 8.3% |
| Immigrants | Portugal | 0.6 /100 | #255 | Tragic 8.3% |
| Celtics | 0.6 /100 | #256 | Tragic 8.3% |
| British West Indians | 0.5 /100 | #257 | Tragic 8.3% |
| Immigrants | Ghana | 0.5 /100 | #258 | Tragic 8.3% |
| Barbadians | 0.4 /100 | #259 | Tragic 8.3% |
| Whites/Caucasians | 0.3 /100 | #260 | Tragic 8.4% |
| Immigrants | Liberia | 0.3 /100 | #261 | Tragic 8.4% |
| West Indians | 0.3 /100 | #262 | Tragic 8.4% |
| Scotch-Irish | 0.3 /100 | #263 | Tragic 8.4% |
| Hondurans | 0.3 /100 | #264 | Tragic 8.4% |
| French Canadians | 0.3 /100 | #265 | Tragic 8.4% |
| Immigrants | Honduras | 0.3 /100 | #266 | Tragic 8.4% |
| Belizeans | 0.2 /100 | #267 | Tragic 8.4% |