Alaskan Athabascan vs White/Caucasian Unemployment Among Women with Children Under 6 years

COMPARE

Alaskan Athabascan
Race
Ancestry
AfghanAfricanAlaska NativeAlaskan AthabascanAlbanianAleutAlsatianAmericanApacheArabArapahoArgentineanArmenianAssyrian/Chaldean/SyriacAustralianAustrianBahamianBangladeshiBarbadianBasqueBelgianBelizeanBermudanBhutaneseBlackfeetBolivianBrazilianBritishBritish West IndianBulgarianBurmeseCajunCambodianCanadianCape VerdeanCarpatho RusynCelticCentral AmericanCentral American IndianCherokeeCheyenneChickasawChileanChineseChippewaChoctawColombianColvilleComancheCosta RicanCreeCreekCroatianCrowCubanCypriotCzechCzechoslovakianDanishDelawareDominicanDutchDutch West IndianEastern EuropeanEcuadorianEgyptianEnglishEstonianEthiopianEuropeanFijianFilipinoFinnishFrenchFrench American IndianFrench CanadianGermanGerman RussianGhanaianGreekGuamanian/ChamorroGuatemalanGuyaneseHaitianHmongHonduranHopiHoumaHungarianIcelanderIndian (Asian)IndonesianInupiatIranianIraqiIrishIroquoisIsraeliItalianJamaicanJapaneseJordanianKenyanKiowaKoreanLaotianLatvianLebaneseLiberianLithuanianLumbeeLuxembourgerMacedonianMalaysianMalteseMarshalleseMenomineeMexicanMexican American IndianMongolianMoroccanNative HawaiianNavajoNepaleseNew ZealanderNicaraguanNigerianNorthern EuropeanNorwegianOkinawanOsageOttawaPaiutePakistaniPalestinianPanamanianParaguayanPennsylvania GermanPeruvianPimaPolishPortuguesePotawatomiPuebloPuerto RicanPuget Sound SalishRomanianRussianSalvadoranSamoanScandinavianScotch-IrishScottishSeminoleSenegaleseSerbianShoshoneSierra LeoneanSiouxSlavicSlovakSloveneSomaliSouth AfricanSouth AmericanSouth American IndianSoviet UnionSpaniardSpanishSpanish AmericanSpanish American IndianSri LankanSubsaharan AfricanSudaneseSwedishSwissSyrianTaiwaneseThaiTlingit-HaidaTohono O'OdhamTonganTrinidadian and TobagonianTsimshianTurkishU.S. Virgin IslanderUgandanUkrainianUruguayanUteVenezuelanVietnameseWelshWest IndianYakamaYaquiYugoslavianYumanYup'ikZimbabwean
Immigration
NonimmigrantsImmigrantsAfghanistanAfricaAlbaniaArgentinaArmeniaAsiaAustraliaAustriaBahamasBangladeshBarbadosBelarusBelgiumBelizeBoliviaBosnia and HerzegovinaBrazilBulgariaBurma/MyanmarCabo VerdeCambodiaCameroonCanadaCaribbeanCentral AmericaChileChinaColombiaCongoCosta RicaCroatiaCubaCzechoslovakiaDenmarkDominicaDominican RepublicEastern AfricaEastern AsiaEastern EuropeEcuadorEgyptEl SalvadorEnglandEritreaEthiopiaEuropeFijiFranceGermanyGhanaGreeceGrenadaGuatemalaGuyanaHaitiHondurasHong KongHungaryIndiaIndonesiaIranIraqIrelandIsraelItalyJamaicaJapanJordanKazakhstanKenyaKoreaKuwaitLaosLatin AmericaLatviaLebanonLiberiaLithuaniaMalaysiaMexicoMicronesiaMiddle AfricaMoldovaMoroccoNepalNetherlandsNicaraguaNigeriaNorth AmericaNorth MacedoniaNorthern AfricaNorthern EuropeNorwayOceaniaPakistanPanamaPeruPhilippinesPolandPortugalRomaniaRussiaSaudi ArabiaScotlandSenegalSerbiaSierra LeoneSingaporeSomaliaSouth AfricaSouth AmericaSouth Central AsiaSouth Eastern AsiaSouthern EuropeSpainSri LankaSt. Vincent and the GrenadinesSudanSwedenSwitzerlandSyriaTaiwanThailandTrinidad and TobagoTurkeyUgandaUkraineUruguayUzbekistanVenezuelaVietnamWest IndiesWestern AfricaWestern AsiaWestern EuropeYemenZaireZimbabweAzores
White/Caucasian
Race
Ancestry
AfghanAfricanAlaska NativeAlbanianAleutAlsatianAmericanApacheArabArapahoArgentineanArmenianAssyrian/Chaldean/SyriacAustralianAustrianBahamianBangladeshiBarbadianBasqueBelgianBelizeanBermudanBhutaneseBlackfeetBolivianBrazilianBritishBritish West IndianBulgarianBurmeseCajunCambodianCanadianCape VerdeanCarpatho RusynCelticCentral AmericanCentral American IndianCherokeeCheyenneChickasawChileanChineseChippewaChoctawColombianColvilleComancheCosta RicanCreeCreekCroatianCrowCubanCypriotCzechCzechoslovakianDanishDelawareDominicanDutchDutch West IndianEastern EuropeanEcuadorianEgyptianEnglishEstonianEthiopianEuropeanFijianFilipinoFinnishFrenchFrench American IndianFrench CanadianGermanGerman RussianGhanaianGreekGuamanian/ChamorroGuatemalanGuyaneseHaitianHmongHonduranHopiHoumaHungarianIcelanderIndian (Asian)IndonesianInupiatIranianIraqiIrishIroquoisIsraeliItalianJamaicanJapaneseJordanianKenyanKiowaKoreanLaotianLatvianLebaneseLiberianLithuanianLumbeeLuxembourgerMacedonianMalaysianMalteseMarshalleseMenomineeMexicanMexican American IndianMongolianMoroccanNative HawaiianNavajoNepaleseNew ZealanderNicaraguanNigerianNorthern EuropeanNorwegianOkinawanOsageOttawaPaiutePakistaniPalestinianPanamanianParaguayanPennsylvania GermanPeruvianPimaPolishPortuguesePotawatomiPuebloPuerto RicanPuget Sound SalishRomanianRussianSalvadoranSamoanScandinavianScotch-IrishScottishSeminoleSenegaleseSerbianShoshoneSierra LeoneanSiouxSlavicSlovakSloveneSomaliSouth AfricanSouth AmericanSouth American IndianSoviet UnionSpaniardSpanishSpanish AmericanSpanish American IndianSri LankanSubsaharan AfricanSudaneseSwedishSwissSyrianTaiwaneseThaiTlingit-HaidaTohono O'OdhamTonganTrinidadian and TobagonianTsimshianTurkishU.S. Virgin IslanderUgandanUkrainianUruguayanUteVenezuelanVietnameseWelshWest IndianYakamaYaquiYugoslavianYumanYup'ikZimbabwean
Immigration
NonimmigrantsImmigrantsAfghanistanAfricaAlbaniaArgentinaArmeniaAsiaAustraliaAustriaBahamasBangladeshBarbadosBelarusBelgiumBelizeBoliviaBosnia and HerzegovinaBrazilBulgariaBurma/MyanmarCabo VerdeCambodiaCameroonCanadaCaribbeanCentral AmericaChileChinaColombiaCongoCosta RicaCroatiaCubaCzechoslovakiaDenmarkDominicaDominican RepublicEastern AfricaEastern AsiaEastern EuropeEcuadorEgyptEl SalvadorEnglandEritreaEthiopiaEuropeFijiFranceGermanyGhanaGreeceGrenadaGuatemalaGuyanaHaitiHondurasHong KongHungaryIndiaIndonesiaIranIraqIrelandIsraelItalyJamaicaJapanJordanKazakhstanKenyaKoreaKuwaitLaosLatin AmericaLatviaLebanonLiberiaLithuaniaMalaysiaMexicoMicronesiaMiddle AfricaMoldovaMoroccoNepalNetherlandsNicaraguaNigeriaNorth AmericaNorth MacedoniaNorthern AfricaNorthern EuropeNorwayOceaniaPakistanPanamaPeruPhilippinesPolandPortugalRomaniaRussiaSaudi ArabiaScotlandSenegalSerbiaSierra LeoneSingaporeSomaliaSouth AfricaSouth AmericaSouth Central AsiaSouth Eastern AsiaSouthern EuropeSpainSri LankaSt. Vincent and the GrenadinesSudanSwedenSwitzerlandSyriaTaiwanThailandTrinidad and TobagoTurkeyUgandaUkraineUruguayUzbekistanVenezuelaVietnamWest IndiesWestern AfricaWestern AsiaWestern EuropeYemenZaireZimbabweAzores
Unemployment Among Women with Children Under 6 years
Income
Poverty
Unemployment
Labor Participation
Family Structure
Vehicle Availability
Education Level
Disability

Unemployment Among Women with Children Under 6 years Comparison

Alaskan Athabascans

Whites/Caucasians

Tragic
Tragic
9.1%
UNEMPLOYMENT AMONG WOMEN WITH CHILDREN UNDER 6 YEARS
0.0/ 100
METRIC RATING
305th/ 347
METRIC RANK
8.4%
UNEMPLOYMENT AMONG WOMEN WITH CHILDREN UNDER 6 YEARS
0.3/ 100
METRIC RATING
260th/ 347
METRIC RANK

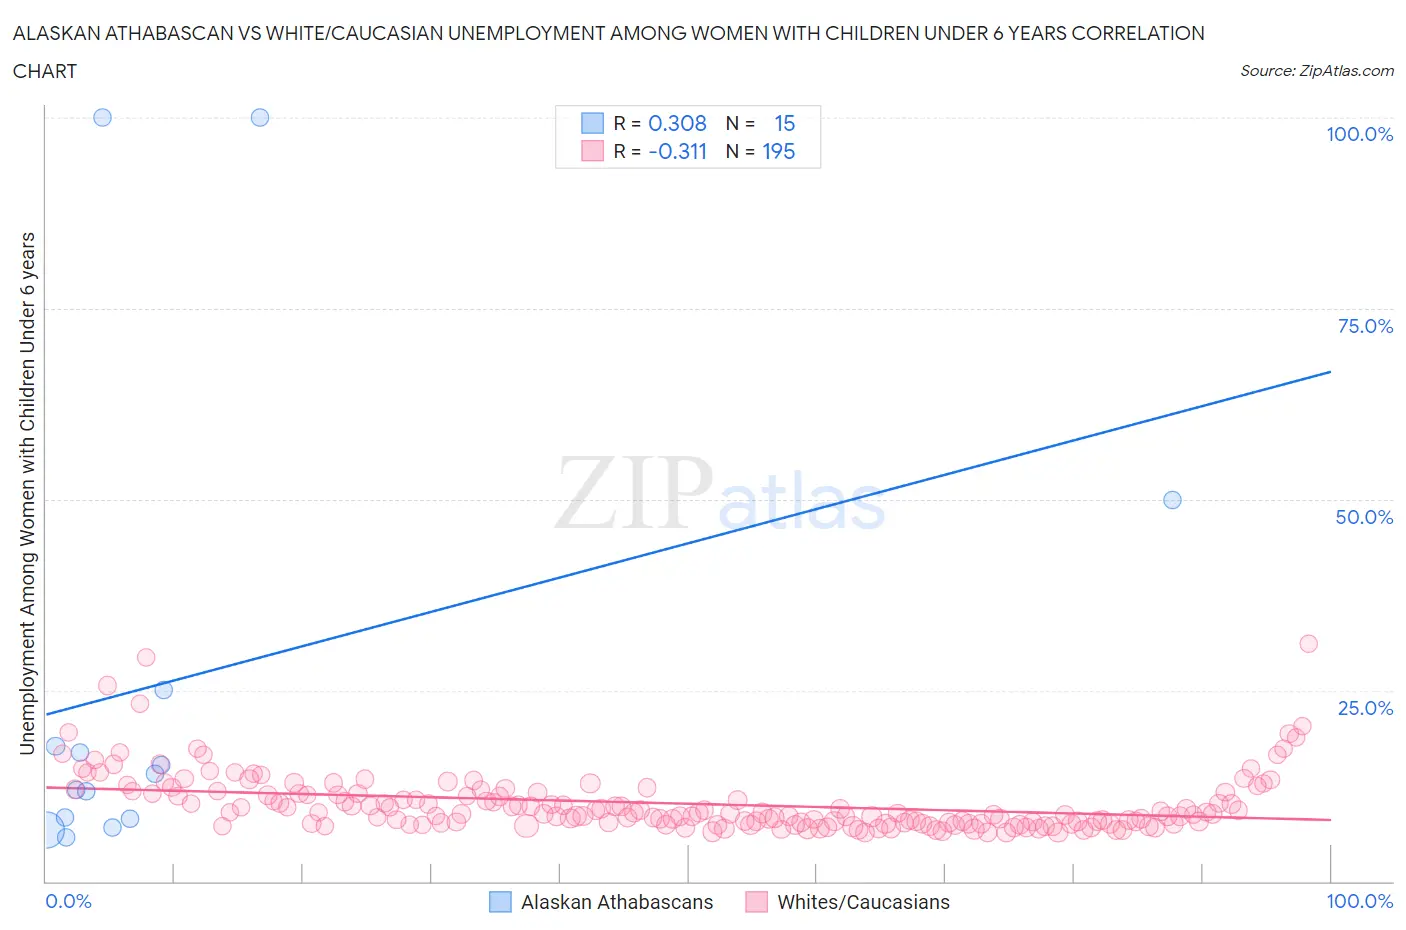
Alaskan Athabascan vs White/Caucasian Unemployment Among Women with Children Under 6 years Correlation Chart

The statistical analysis conducted on geographies consisting of 41,393,771 people shows a mild positive correlation between the proportion of Alaskan Athabascans and unemployment rate among women with children under the age of 6 in the United States with a correlation coefficient (R) of 0.308 and weighted average of 9.1%. Similarly, the statistical analysis conducted on geographies consisting of 381,009,459 people shows a mild negative correlation between the proportion of Whites/Caucasians and unemployment rate among women with children under the age of 6 in the United States with a correlation coefficient (R) of -0.311 and weighted average of 8.4%, a difference of 8.7%.
Alaskan Athabascan vs White/Caucasian Unemployment Among Women with Children Under 6 years

Unemployment Among Women with Children Under 6 years Correlation Summary

MeasurementAlaskan AthabascanWhite/Caucasian
Minimum5.7%6.3%
Maximum100.0%31.1%
Range94.3%24.8%
Mean26.6%10.2%
Median14.1%8.9%
Interquartile 25% (IQ1)8.2%7.6%
Interquartile 75% (IQ3)25.0%11.5%
Interquartile Range (IQR)16.8%3.9%
Standard Deviation (Sample)31.7%3.9%
Standard Deviation (Population)30.7%3.9%

Similar Demographics by Unemployment Among Women with Children Under 6 years

Demographics Similar to Alaskan Athabascans by Unemployment Among Women with Children Under 6 years

In terms of unemployment among women with children under 6 years, the demographic groups most similar to Alaskan Athabascans are Pueblo (9.1%, a difference of 0.17%), Dominican (9.1%, a difference of 0.29%), Immigrants from Micronesia (9.1%, a difference of 0.36%), Immigrants from Mexico (9.1%, a difference of 0.41%), and Immigrants from West Indies (9.0%, a difference of 0.55%).
DemographicsRating | RankUnemployment Among Women with Children Under 6 years
Tlingit-Haida
0.0
/100
|
#298
Tragic
8.9%
Immigrants | Jamaica
0.0
/100
|
#299
Tragic
8.9%
Creek
0.0
/100
|
#300
Tragic
8.9%
Chickasaw
0.0
/100
|
#301
Tragic
9.0%
Hispanics or Latinos
0.0
/100
|
#302
Tragic
9.0%
Immigrants | West Indies
0.0
/100
|
#303
Tragic
9.0%
Immigrants | Mexico
0.0
/100
|
#304
Tragic
9.1%
Alaskan Athabascans
0.0
/100
|
#305
Tragic
9.1%
Pueblo
0.0
/100
|
#306
Tragic
9.1%
Dominicans
0.0
/100
|
#307
Tragic
9.1%
Immigrants | Micronesia
0.0
/100
|
#308
Tragic
9.1%
Africans
0.0
/100
|
#309
Tragic
9.2%
Cajuns
0.0
/100
|
#310
Tragic
9.2%
French American Indians
0.0
/100
|
#311
Tragic
9.2%
Immigrants | Azores
0.0
/100
|
#312
Tragic
9.2%

Demographics Similar to Whites/Caucasians by Unemployment Among Women with Children Under 6 years

In terms of unemployment among women with children under 6 years, the demographic groups most similar to Whites/Caucasians are Barbadian (8.3%, a difference of 0.26%), Immigrants from Liberia (8.4%, a difference of 0.28%), West Indian (8.4%, a difference of 0.29%), Scotch-Irish (8.4%, a difference of 0.32%), and Honduran (8.4%, a difference of 0.35%).
DemographicsRating | RankUnemployment Among Women with Children Under 6 years
Immigrants | Guyana
0.8
/100
|
#253
Tragic
8.2%
Immigrants | Caribbean
0.7
/100
|
#254
Tragic
8.3%
Immigrants | Portugal
0.6
/100
|
#255
Tragic
8.3%
Celtics
0.6
/100
|
#256
Tragic
8.3%
British West Indians
0.5
/100
|
#257
Tragic
8.3%
Immigrants | Ghana
0.5
/100
|
#258
Tragic
8.3%
Barbadians
0.4
/100
|
#259
Tragic
8.3%
Whites/Caucasians
0.3
/100
|
#260
Tragic
8.4%
Immigrants | Liberia
0.3
/100
|
#261
Tragic
8.4%
West Indians
0.3
/100
|
#262
Tragic
8.4%
Scotch-Irish
0.3
/100
|
#263
Tragic
8.4%
Hondurans
0.3
/100
|
#264
Tragic
8.4%
French Canadians
0.3
/100
|
#265
Tragic
8.4%
Immigrants | Honduras
0.3
/100
|
#266
Tragic
8.4%
Belizeans
0.2
/100
|
#267
Tragic
8.4%