Asian vs White/Caucasian Unemployment Among Women with Children Under 6 years
COMPARE
Asian
White/Caucasian
Unemployment Among Women with Children Under 6 years
Unemployment Among Women with Children Under 6 years Comparison
Asians
Whites/Caucasians
6.7%
UNEMPLOYMENT AMONG WOMEN WITH CHILDREN UNDER 6 YEARS
100.0/ 100
METRIC RATING
40th/ 347
METRIC RANK
8.4%
UNEMPLOYMENT AMONG WOMEN WITH CHILDREN UNDER 6 YEARS
0.3/ 100
METRIC RATING
260th/ 347
METRIC RANK
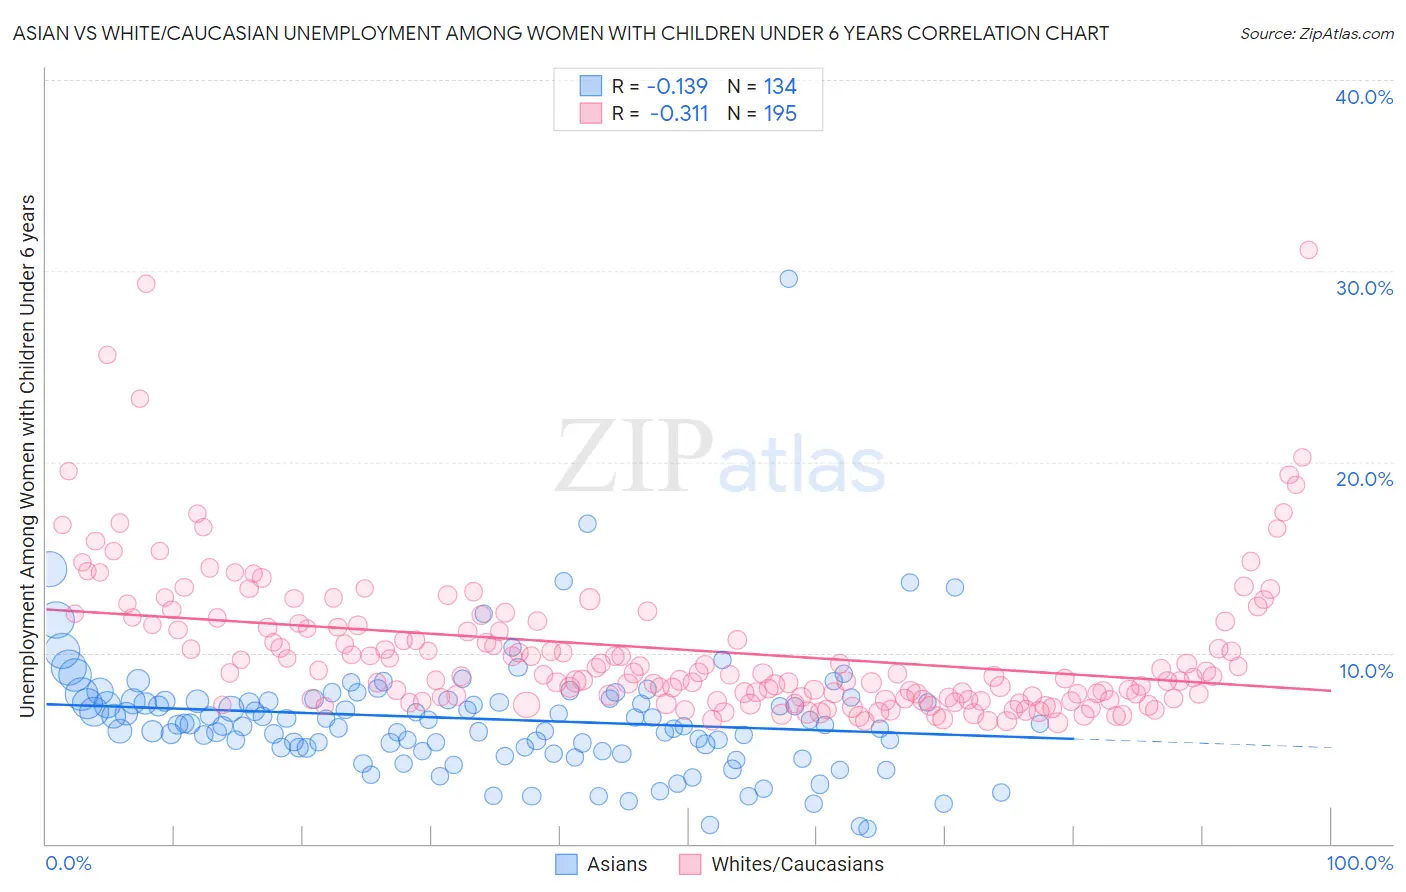
Asian vs White/Caucasian Unemployment Among Women with Children Under 6 years Correlation Chart
The statistical analysis conducted on geographies consisting of 374,627,418 people shows a poor negative correlation between the proportion of Asians and unemployment rate among women with children under the age of 6 in the United States with a correlation coefficient (R) of -0.139 and weighted average of 6.7%. Similarly, the statistical analysis conducted on geographies consisting of 381,009,459 people shows a mild negative correlation between the proportion of Whites/Caucasians and unemployment rate among women with children under the age of 6 in the United States with a correlation coefficient (R) of -0.311 and weighted average of 8.4%, a difference of 25.3%.
Unemployment Among Women with Children Under 6 years Correlation Summary
| Measurement | Asian | White/Caucasian |
| Minimum | 0.80% | 6.3% |
| Maximum | 29.6% | 31.1% |
| Range | 28.8% | 24.8% |
| Mean | 6.5% | 10.2% |
| Median | 6.3% | 8.9% |
| Interquartile 25% (IQ1) | 5.0% | 7.6% |
| Interquartile 75% (IQ3) | 7.5% | 11.5% |
| Interquartile Range (IQR) | 2.5% | 3.9% |
| Standard Deviation (Sample) | 3.3% | 3.9% |
| Standard Deviation (Population) | 3.3% | 3.9% |
Similar Demographics by Unemployment Among Women with Children Under 6 years
Demographics Similar to Asians by Unemployment Among Women with Children Under 6 years
In terms of unemployment among women with children under 6 years, the demographic groups most similar to Asians are Immigrants from Indonesia (6.7%, a difference of 0.16%), Immigrants from Russia (6.7%, a difference of 0.22%), Immigrants from Cuba (6.7%, a difference of 0.26%), Hmong (6.7%, a difference of 0.28%), and Sri Lankan (6.6%, a difference of 0.41%).
| Demographics | Rating | Rank | Unemployment Among Women with Children Under 6 years |
| Immigrants | Vietnam | 100.0 /100 | #33 | Exceptional 6.6% |
| Immigrants | South Central Asia | 100.0 /100 | #34 | Exceptional 6.6% |
| Yakama | 100.0 /100 | #35 | Exceptional 6.6% |
| Luxembourgers | 100.0 /100 | #36 | Exceptional 6.6% |
| Sri Lankans | 100.0 /100 | #37 | Exceptional 6.6% |
| Hmong | 100.0 /100 | #38 | Exceptional 6.7% |
| Immigrants | Russia | 100.0 /100 | #39 | Exceptional 6.7% |
| Asians | 100.0 /100 | #40 | Exceptional 6.7% |
| Immigrants | Indonesia | 99.9 /100 | #41 | Exceptional 6.7% |
| Immigrants | Cuba | 99.9 /100 | #42 | Exceptional 6.7% |
| Bhutanese | 99.9 /100 | #43 | Exceptional 6.7% |
| Iranians | 99.9 /100 | #44 | Exceptional 6.7% |
| Immigrants | Australia | 99.9 /100 | #45 | Exceptional 6.8% |
| Latvians | 99.9 /100 | #46 | Exceptional 6.8% |
| Immigrants | Asia | 99.9 /100 | #47 | Exceptional 6.8% |
Demographics Similar to Whites/Caucasians by Unemployment Among Women with Children Under 6 years
In terms of unemployment among women with children under 6 years, the demographic groups most similar to Whites/Caucasians are Barbadian (8.3%, a difference of 0.26%), Immigrants from Liberia (8.4%, a difference of 0.28%), West Indian (8.4%, a difference of 0.29%), Scotch-Irish (8.4%, a difference of 0.32%), and Honduran (8.4%, a difference of 0.35%).
| Demographics | Rating | Rank | Unemployment Among Women with Children Under 6 years |
| Immigrants | Guyana | 0.8 /100 | #253 | Tragic 8.2% |
| Immigrants | Caribbean | 0.7 /100 | #254 | Tragic 8.3% |
| Immigrants | Portugal | 0.6 /100 | #255 | Tragic 8.3% |
| Celtics | 0.6 /100 | #256 | Tragic 8.3% |
| British West Indians | 0.5 /100 | #257 | Tragic 8.3% |
| Immigrants | Ghana | 0.5 /100 | #258 | Tragic 8.3% |
| Barbadians | 0.4 /100 | #259 | Tragic 8.3% |
| Whites/Caucasians | 0.3 /100 | #260 | Tragic 8.4% |
| Immigrants | Liberia | 0.3 /100 | #261 | Tragic 8.4% |
| West Indians | 0.3 /100 | #262 | Tragic 8.4% |
| Scotch-Irish | 0.3 /100 | #263 | Tragic 8.4% |
| Hondurans | 0.3 /100 | #264 | Tragic 8.4% |
| French Canadians | 0.3 /100 | #265 | Tragic 8.4% |
| Immigrants | Honduras | 0.3 /100 | #266 | Tragic 8.4% |
| Belizeans | 0.2 /100 | #267 | Tragic 8.4% |