Marshallese vs Arapaho Unemployment Among Women with Children Under 6 years
COMPARE
Marshallese
Arapaho
Unemployment Among Women with Children Under 6 years
Unemployment Among Women with Children Under 6 years Comparison
Marshallese
Arapaho
9.6%
UNEMPLOYMENT AMONG WOMEN WITH CHILDREN UNDER 6 YEARS
0.0/ 100
METRIC RATING
319th/ 347
METRIC RANK
19.0%
UNEMPLOYMENT AMONG WOMEN WITH CHILDREN UNDER 6 YEARS
0.0/ 100
METRIC RATING
346th/ 347
METRIC RANK
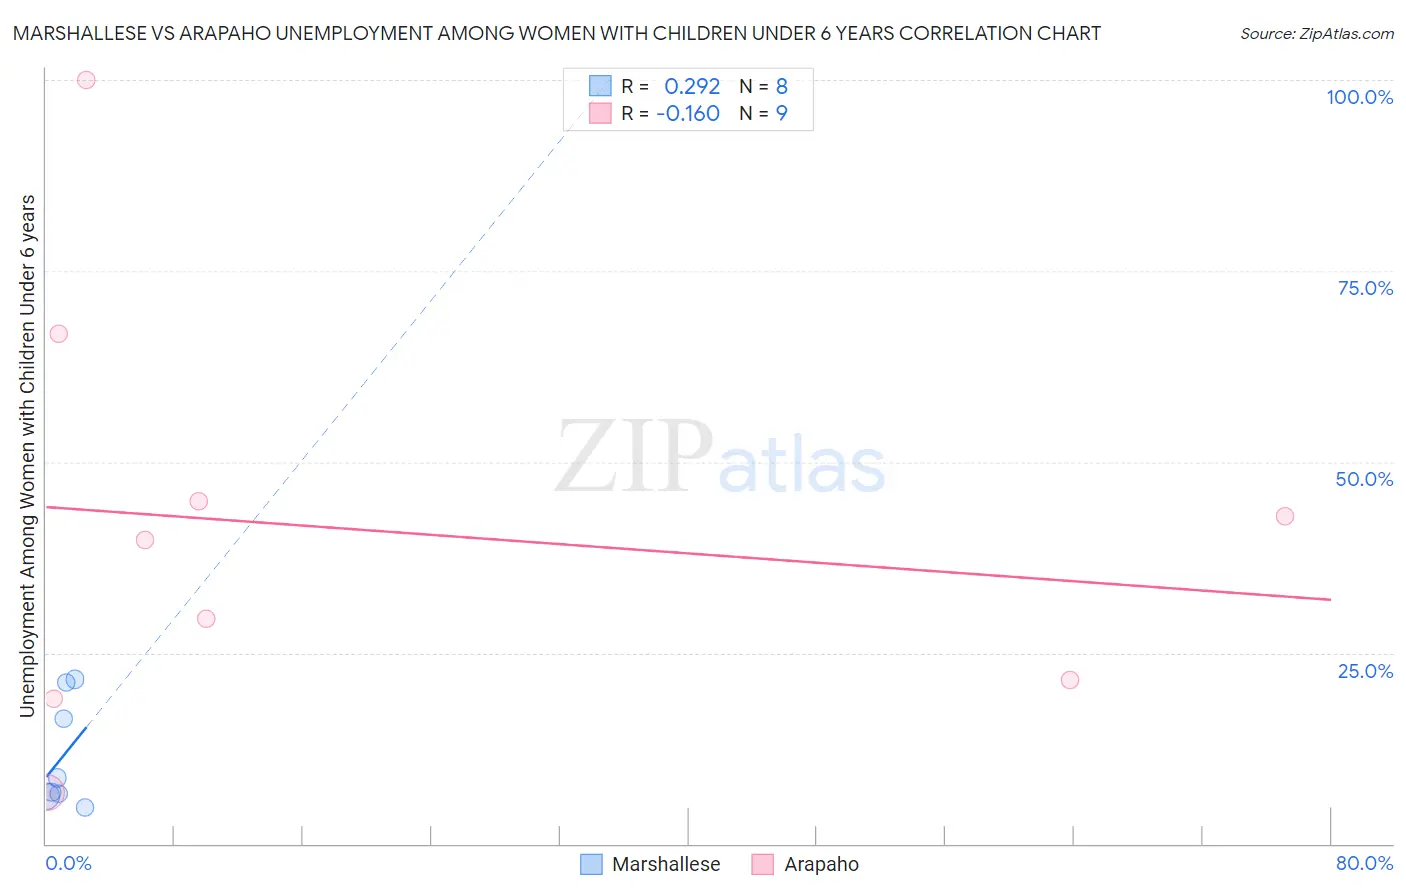
Marshallese vs Arapaho Unemployment Among Women with Children Under 6 years Correlation Chart
The statistical analysis conducted on geographies consisting of 13,939,476 people shows a weak positive correlation between the proportion of Marshallese and unemployment rate among women with children under the age of 6 in the United States with a correlation coefficient (R) of 0.292 and weighted average of 9.6%. Similarly, the statistical analysis conducted on geographies consisting of 26,873,708 people shows a poor negative correlation between the proportion of Arapaho and unemployment rate among women with children under the age of 6 in the United States with a correlation coefficient (R) of -0.160 and weighted average of 19.0%, a difference of 98.7%.
Unemployment Among Women with Children Under 6 years Correlation Summary
| Measurement | Marshallese | Arapaho |
| Minimum | 4.8% | 6.7% |
| Maximum | 21.5% | 100.0% |
| Range | 16.7% | 93.3% |
| Mean | 11.5% | 41.2% |
| Median | 7.7% | 39.8% |
| Interquartile 25% (IQ1) | 6.4% | 20.2% |
| Interquartile 75% (IQ3) | 18.7% | 55.8% |
| Interquartile Range (IQR) | 12.3% | 35.6% |
| Standard Deviation (Sample) | 7.0% | 28.1% |
| Standard Deviation (Population) | 6.6% | 26.5% |
Similar Demographics by Unemployment Among Women with Children Under 6 years
Demographics Similar to Marshallese by Unemployment Among Women with Children Under 6 years
In terms of unemployment among women with children under 6 years, the demographic groups most similar to Marshallese are Potawatomi (9.6%, a difference of 0.050%), Central American Indian (9.6%, a difference of 0.11%), Alaska Native (9.6%, a difference of 0.36%), Immigrants from Bahamas (9.6%, a difference of 0.55%), and Osage (9.5%, a difference of 1.0%).
| Demographics | Rating | Rank | Unemployment Among Women with Children Under 6 years |
| Immigrants | Azores | 0.0 /100 | #312 | Tragic 9.2% |
| Americans | 0.0 /100 | #313 | Tragic 9.3% |
| Fijians | 0.0 /100 | #314 | Tragic 9.3% |
| Cherokee | 0.0 /100 | #315 | Tragic 9.3% |
| Houma | 0.0 /100 | #316 | Tragic 9.4% |
| Dutch West Indians | 0.0 /100 | #317 | Tragic 9.5% |
| Osage | 0.0 /100 | #318 | Tragic 9.5% |
| Marshallese | 0.0 /100 | #319 | Tragic 9.6% |
| Potawatomi | 0.0 /100 | #320 | Tragic 9.6% |
| Central American Indians | 0.0 /100 | #321 | Tragic 9.6% |
| Alaska Natives | 0.0 /100 | #322 | Tragic 9.6% |
| Immigrants | Bahamas | 0.0 /100 | #323 | Tragic 9.6% |
| Paiute | 0.0 /100 | #324 | Tragic 9.7% |
| Choctaw | 0.0 /100 | #325 | Tragic 9.8% |
| Delaware | 0.0 /100 | #326 | Tragic 9.8% |
Demographics Similar to Arapaho by Unemployment Among Women with Children Under 6 years
In terms of unemployment among women with children under 6 years, the demographic groups most similar to Arapaho are Inupiat (17.7%, a difference of 7.5%), Yup'ik (21.1%, a difference of 10.6%), Hopi (16.8%, a difference of 13.5%), Crow (14.6%, a difference of 30.0%), and Yuman (14.6%, a difference of 30.1%).
| Demographics | Rating | Rank | Unemployment Among Women with Children Under 6 years |
| Natives/Alaskans | 0.0 /100 | #333 | Tragic 11.5% |
| Apache | 0.0 /100 | #334 | Tragic 12.3% |
| Puerto Ricans | 0.0 /100 | #335 | Tragic 12.5% |
| Shoshone | 0.0 /100 | #336 | Tragic 13.2% |
| Chippewa | 0.0 /100 | #337 | Tragic 13.3% |
| Pima | 0.0 /100 | #338 | Tragic 13.4% |
| Navajo | 0.0 /100 | #339 | Tragic 13.5% |
| Immigrants | Yemen | 0.0 /100 | #340 | Tragic 13.5% |
| Lumbee | 0.0 /100 | #341 | Tragic 13.8% |
| Yuman | 0.0 /100 | #342 | Tragic 14.6% |
| Crow | 0.0 /100 | #343 | Tragic 14.6% |
| Hopi | 0.0 /100 | #344 | Tragic 16.8% |
| Inupiat | 0.0 /100 | #345 | Tragic 17.7% |
| Arapaho | 0.0 /100 | #346 | Tragic 19.0% |
| Yup'ik | 0.0 /100 | #347 | Tragic 21.1% |