Immigrants from Spain vs White/Caucasian Unemployment Among Women with Children Under 6 years
COMPARE
Immigrants from Spain
White/Caucasian
Unemployment Among Women with Children Under 6 years
Unemployment Among Women with Children Under 6 years Comparison
Immigrants from Spain
Whites/Caucasians
7.1%
UNEMPLOYMENT AMONG WOMEN WITH CHILDREN UNDER 6 YEARS
98.2/ 100
METRIC RATING
90th/ 347
METRIC RANK
8.4%
UNEMPLOYMENT AMONG WOMEN WITH CHILDREN UNDER 6 YEARS
0.3/ 100
METRIC RATING
260th/ 347
METRIC RANK
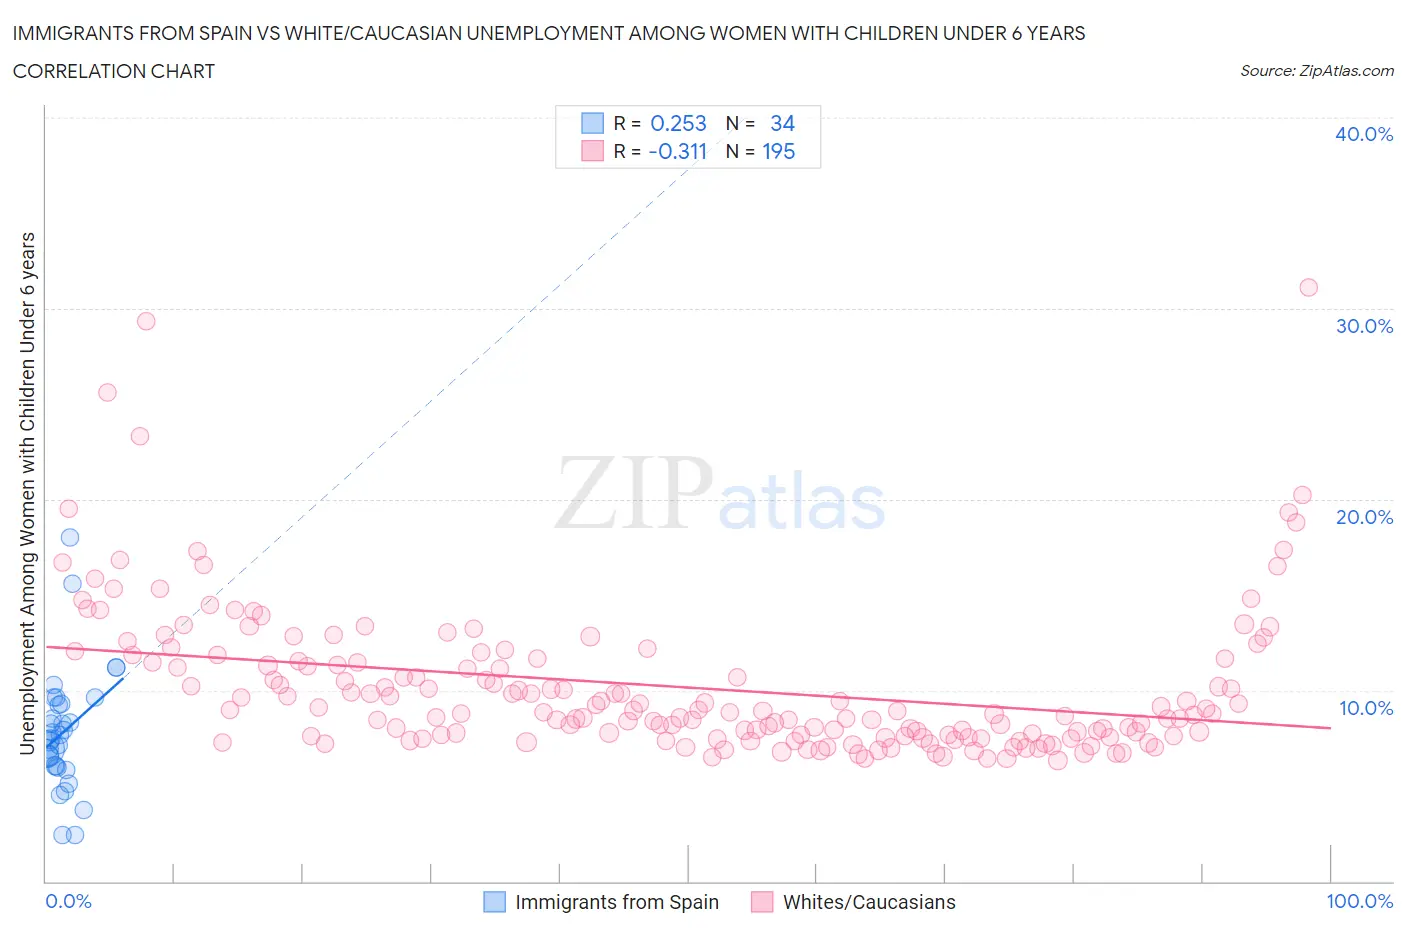
Immigrants from Spain vs White/Caucasian Unemployment Among Women with Children Under 6 years Correlation Chart
The statistical analysis conducted on geographies consisting of 198,053,319 people shows a weak positive correlation between the proportion of Immigrants from Spain and unemployment rate among women with children under the age of 6 in the United States with a correlation coefficient (R) of 0.253 and weighted average of 7.1%. Similarly, the statistical analysis conducted on geographies consisting of 381,009,459 people shows a mild negative correlation between the proportion of Whites/Caucasians and unemployment rate among women with children under the age of 6 in the United States with a correlation coefficient (R) of -0.311 and weighted average of 8.4%, a difference of 17.2%.
Unemployment Among Women with Children Under 6 years Correlation Summary
| Measurement | Immigrants from Spain | White/Caucasian |
| Minimum | 2.4% | 6.3% |
| Maximum | 18.0% | 31.1% |
| Range | 15.6% | 24.8% |
| Mean | 7.8% | 10.2% |
| Median | 7.5% | 8.9% |
| Interquartile 25% (IQ1) | 6.0% | 7.6% |
| Interquartile 75% (IQ3) | 9.3% | 11.5% |
| Interquartile Range (IQR) | 3.3% | 3.9% |
| Standard Deviation (Sample) | 3.2% | 3.9% |
| Standard Deviation (Population) | 3.1% | 3.9% |
Similar Demographics by Unemployment Among Women with Children Under 6 years
Demographics Similar to Immigrants from Spain by Unemployment Among Women with Children Under 6 years
In terms of unemployment among women with children under 6 years, the demographic groups most similar to Immigrants from Spain are Immigrants from Denmark (7.1%, a difference of 0.050%), Danish (7.1%, a difference of 0.060%), Immigrants from Hungary (7.1%, a difference of 0.090%), Albanian (7.2%, a difference of 0.20%), and Alsatian (7.1%, a difference of 0.22%).
| Demographics | Rating | Rank | Unemployment Among Women with Children Under 6 years |
| Egyptians | 98.7 /100 | #83 | Exceptional 7.1% |
| Immigrants | Albania | 98.7 /100 | #84 | Exceptional 7.1% |
| Immigrants | Romania | 98.7 /100 | #85 | Exceptional 7.1% |
| Immigrants | Zimbabwe | 98.6 /100 | #86 | Exceptional 7.1% |
| Alsatians | 98.4 /100 | #87 | Exceptional 7.1% |
| Immigrants | Hungary | 98.3 /100 | #88 | Exceptional 7.1% |
| Immigrants | Denmark | 98.3 /100 | #89 | Exceptional 7.1% |
| Immigrants | Spain | 98.2 /100 | #90 | Exceptional 7.1% |
| Danes | 98.2 /100 | #91 | Exceptional 7.1% |
| Albanians | 98.0 /100 | #92 | Exceptional 7.2% |
| New Zealanders | 97.8 /100 | #93 | Exceptional 7.2% |
| Macedonians | 97.7 /100 | #94 | Exceptional 7.2% |
| Romanians | 97.7 /100 | #95 | Exceptional 7.2% |
| Immigrants | Eastern Africa | 97.7 /100 | #96 | Exceptional 7.2% |
| Immigrants | South Eastern Asia | 97.6 /100 | #97 | Exceptional 7.2% |
Demographics Similar to Whites/Caucasians by Unemployment Among Women with Children Under 6 years
In terms of unemployment among women with children under 6 years, the demographic groups most similar to Whites/Caucasians are Barbadian (8.3%, a difference of 0.26%), Immigrants from Liberia (8.4%, a difference of 0.28%), West Indian (8.4%, a difference of 0.29%), Scotch-Irish (8.4%, a difference of 0.32%), and Honduran (8.4%, a difference of 0.35%).
| Demographics | Rating | Rank | Unemployment Among Women with Children Under 6 years |
| Immigrants | Guyana | 0.8 /100 | #253 | Tragic 8.2% |
| Immigrants | Caribbean | 0.7 /100 | #254 | Tragic 8.3% |
| Immigrants | Portugal | 0.6 /100 | #255 | Tragic 8.3% |
| Celtics | 0.6 /100 | #256 | Tragic 8.3% |
| British West Indians | 0.5 /100 | #257 | Tragic 8.3% |
| Immigrants | Ghana | 0.5 /100 | #258 | Tragic 8.3% |
| Barbadians | 0.4 /100 | #259 | Tragic 8.3% |
| Whites/Caucasians | 0.3 /100 | #260 | Tragic 8.4% |
| Immigrants | Liberia | 0.3 /100 | #261 | Tragic 8.4% |
| West Indians | 0.3 /100 | #262 | Tragic 8.4% |
| Scotch-Irish | 0.3 /100 | #263 | Tragic 8.4% |
| Hondurans | 0.3 /100 | #264 | Tragic 8.4% |
| French Canadians | 0.3 /100 | #265 | Tragic 8.4% |
| Immigrants | Honduras | 0.3 /100 | #266 | Tragic 8.4% |
| Belizeans | 0.2 /100 | #267 | Tragic 8.4% |