Marshallese vs Chinese Unemployment Among Women with Children Under 6 years
COMPARE
Marshallese
Chinese
Unemployment Among Women with Children Under 6 years
Unemployment Among Women with Children Under 6 years Comparison
Marshallese
Chinese
9.6%
UNEMPLOYMENT AMONG WOMEN WITH CHILDREN UNDER 6 YEARS
0.0/ 100
METRIC RATING
319th/ 347
METRIC RANK
6.8%
UNEMPLOYMENT AMONG WOMEN WITH CHILDREN UNDER 6 YEARS
99.9/ 100
METRIC RATING
53rd/ 347
METRIC RANK
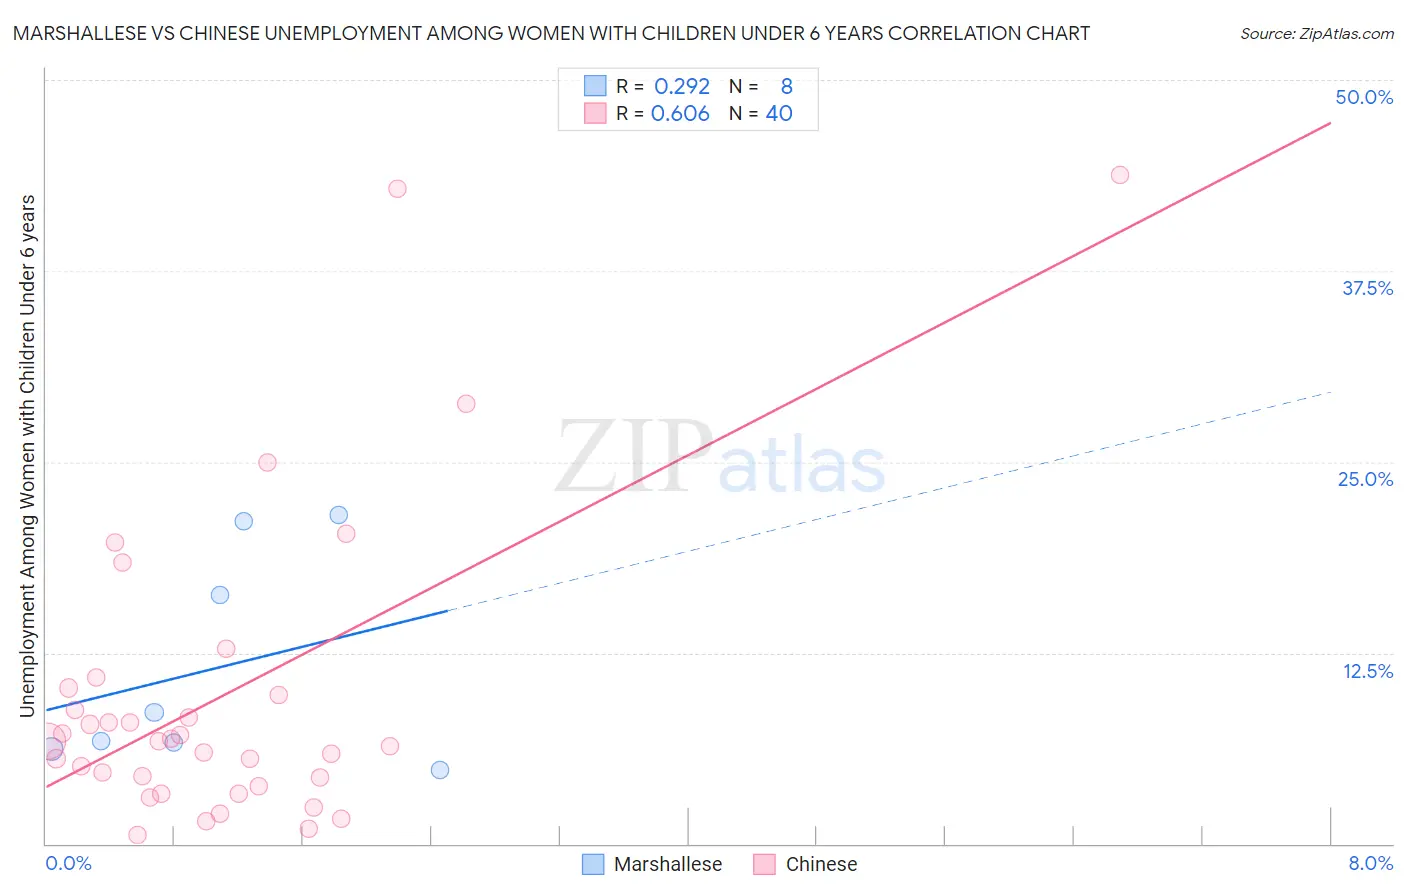
Marshallese vs Chinese Unemployment Among Women with Children Under 6 years Correlation Chart
The statistical analysis conducted on geographies consisting of 13,939,476 people shows a weak positive correlation between the proportion of Marshallese and unemployment rate among women with children under the age of 6 in the United States with a correlation coefficient (R) of 0.292 and weighted average of 9.6%. Similarly, the statistical analysis conducted on geographies consisting of 60,145,529 people shows a significant positive correlation between the proportion of Chinese and unemployment rate among women with children under the age of 6 in the United States with a correlation coefficient (R) of 0.606 and weighted average of 6.8%, a difference of 40.8%.
Unemployment Among Women with Children Under 6 years Correlation Summary
| Measurement | Marshallese | Chinese |
| Minimum | 4.8% | 0.58% |
| Maximum | 21.5% | 43.8% |
| Range | 16.7% | 43.2% |
| Mean | 11.5% | 9.7% |
| Median | 7.7% | 6.7% |
| Interquartile 25% (IQ1) | 6.4% | 4.1% |
| Interquartile 75% (IQ3) | 18.7% | 9.9% |
| Interquartile Range (IQR) | 12.3% | 5.9% |
| Standard Deviation (Sample) | 7.0% | 10.1% |
| Standard Deviation (Population) | 6.6% | 9.9% |
Similar Demographics by Unemployment Among Women with Children Under 6 years
Demographics Similar to Marshallese by Unemployment Among Women with Children Under 6 years
In terms of unemployment among women with children under 6 years, the demographic groups most similar to Marshallese are Potawatomi (9.6%, a difference of 0.050%), Central American Indian (9.6%, a difference of 0.11%), Alaska Native (9.6%, a difference of 0.36%), Immigrants from Bahamas (9.6%, a difference of 0.55%), and Osage (9.5%, a difference of 1.0%).
| Demographics | Rating | Rank | Unemployment Among Women with Children Under 6 years |
| Immigrants | Azores | 0.0 /100 | #312 | Tragic 9.2% |
| Americans | 0.0 /100 | #313 | Tragic 9.3% |
| Fijians | 0.0 /100 | #314 | Tragic 9.3% |
| Cherokee | 0.0 /100 | #315 | Tragic 9.3% |
| Houma | 0.0 /100 | #316 | Tragic 9.4% |
| Dutch West Indians | 0.0 /100 | #317 | Tragic 9.5% |
| Osage | 0.0 /100 | #318 | Tragic 9.5% |
| Marshallese | 0.0 /100 | #319 | Tragic 9.6% |
| Potawatomi | 0.0 /100 | #320 | Tragic 9.6% |
| Central American Indians | 0.0 /100 | #321 | Tragic 9.6% |
| Alaska Natives | 0.0 /100 | #322 | Tragic 9.6% |
| Immigrants | Bahamas | 0.0 /100 | #323 | Tragic 9.6% |
| Paiute | 0.0 /100 | #324 | Tragic 9.7% |
| Choctaw | 0.0 /100 | #325 | Tragic 9.8% |
| Delaware | 0.0 /100 | #326 | Tragic 9.8% |
Demographics Similar to Chinese by Unemployment Among Women with Children Under 6 years
In terms of unemployment among women with children under 6 years, the demographic groups most similar to Chinese are Immigrants from Iran (6.8%, a difference of 0.070%), Immigrants from Latvia (6.8%, a difference of 0.17%), Ethiopian (6.8%, a difference of 0.19%), Immigrants from Ireland (6.8%, a difference of 0.20%), and Immigrants from Nepal (6.8%, a difference of 0.21%).
| Demographics | Rating | Rank | Unemployment Among Women with Children Under 6 years |
| Latvians | 99.9 /100 | #46 | Exceptional 6.8% |
| Immigrants | Asia | 99.9 /100 | #47 | Exceptional 6.8% |
| Immigrants | Switzerland | 99.9 /100 | #48 | Exceptional 6.8% |
| Immigrants | Nepal | 99.9 /100 | #49 | Exceptional 6.8% |
| Immigrants | Ireland | 99.9 /100 | #50 | Exceptional 6.8% |
| Ethiopians | 99.9 /100 | #51 | Exceptional 6.8% |
| Immigrants | Iran | 99.9 /100 | #52 | Exceptional 6.8% |
| Chinese | 99.9 /100 | #53 | Exceptional 6.8% |
| Immigrants | Latvia | 99.9 /100 | #54 | Exceptional 6.8% |
| Immigrants | Ukraine | 99.8 /100 | #55 | Exceptional 6.8% |
| Immigrants | Ethiopia | 99.8 /100 | #56 | Exceptional 6.9% |
| Icelanders | 99.8 /100 | #57 | Exceptional 6.9% |
| Immigrants | Turkey | 99.8 /100 | #58 | Exceptional 6.9% |
| Immigrants | Serbia | 99.8 /100 | #59 | Exceptional 6.9% |
| Immigrants | Sri Lanka | 99.8 /100 | #60 | Exceptional 6.9% |