Marshallese vs Syrian Unemployment Among Women with Children Under 6 years
COMPARE
Marshallese
Syrian
Unemployment Among Women with Children Under 6 years
Unemployment Among Women with Children Under 6 years Comparison
Marshallese
Syrians
9.6%
UNEMPLOYMENT AMONG WOMEN WITH CHILDREN UNDER 6 YEARS
0.0/ 100
METRIC RATING
319th/ 347
METRIC RANK
7.7%
UNEMPLOYMENT AMONG WOMEN WITH CHILDREN UNDER 6 YEARS
31.9/ 100
METRIC RATING
194th/ 347
METRIC RANK
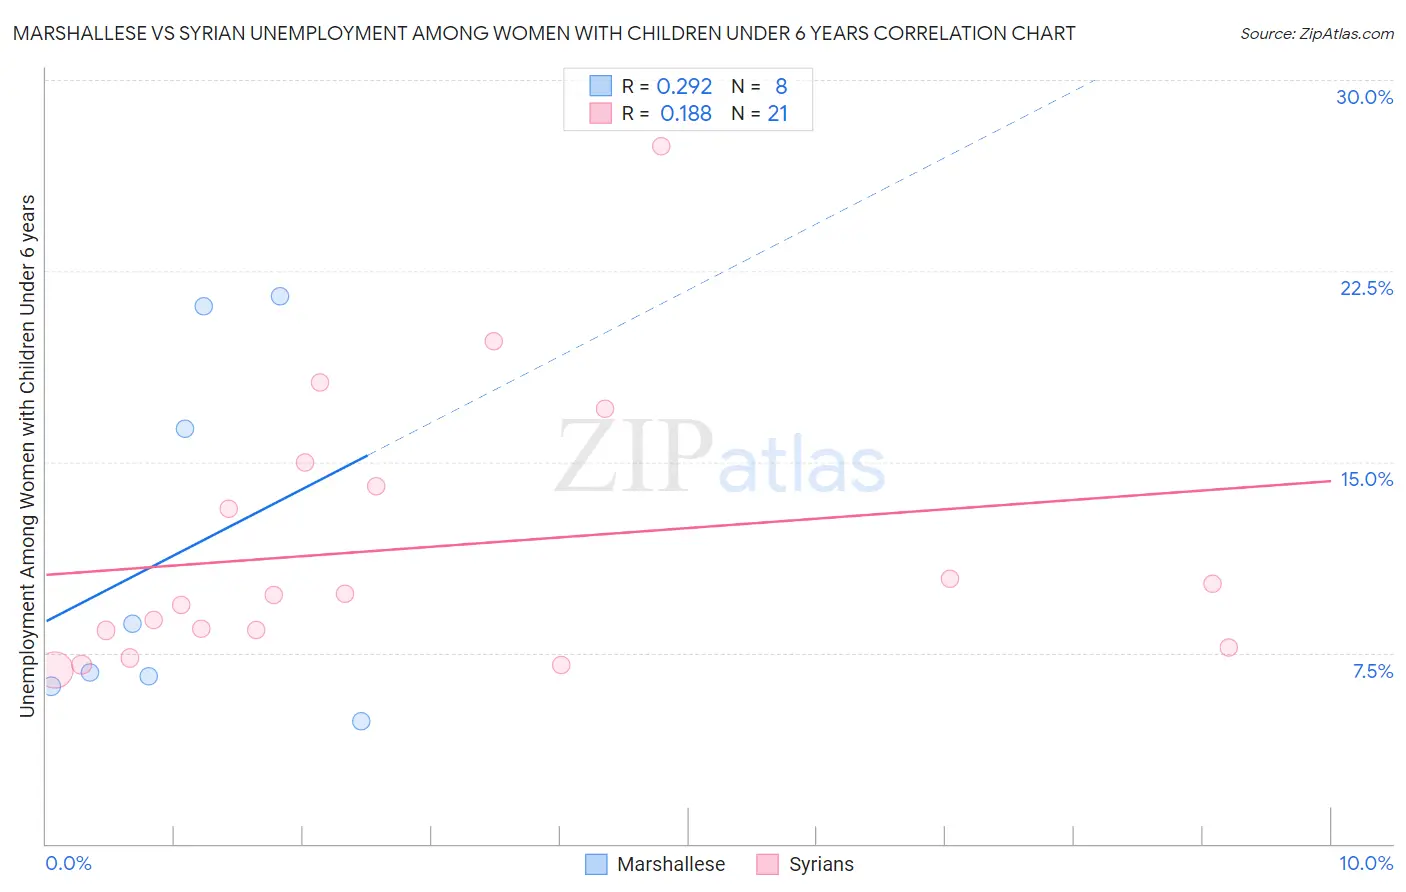
Marshallese vs Syrian Unemployment Among Women with Children Under 6 years Correlation Chart
The statistical analysis conducted on geographies consisting of 13,939,476 people shows a weak positive correlation between the proportion of Marshallese and unemployment rate among women with children under the age of 6 in the United States with a correlation coefficient (R) of 0.292 and weighted average of 9.6%. Similarly, the statistical analysis conducted on geographies consisting of 214,063,648 people shows a poor positive correlation between the proportion of Syrians and unemployment rate among women with children under the age of 6 in the United States with a correlation coefficient (R) of 0.188 and weighted average of 7.7%, a difference of 23.7%.
Unemployment Among Women with Children Under 6 years Correlation Summary
| Measurement | Marshallese | Syrian |
| Minimum | 4.8% | 6.8% |
| Maximum | 21.5% | 27.4% |
| Range | 16.7% | 20.6% |
| Mean | 11.5% | 11.6% |
| Median | 7.7% | 9.8% |
| Interquartile 25% (IQ1) | 6.4% | 8.0% |
| Interquartile 75% (IQ3) | 18.7% | 14.5% |
| Interquartile Range (IQR) | 12.3% | 6.5% |
| Standard Deviation (Sample) | 7.0% | 5.3% |
| Standard Deviation (Population) | 6.6% | 5.2% |
Similar Demographics by Unemployment Among Women with Children Under 6 years
Demographics Similar to Marshallese by Unemployment Among Women with Children Under 6 years
In terms of unemployment among women with children under 6 years, the demographic groups most similar to Marshallese are Potawatomi (9.6%, a difference of 0.050%), Central American Indian (9.6%, a difference of 0.11%), Alaska Native (9.6%, a difference of 0.36%), Immigrants from Bahamas (9.6%, a difference of 0.55%), and Osage (9.5%, a difference of 1.0%).
| Demographics | Rating | Rank | Unemployment Among Women with Children Under 6 years |
| Immigrants | Azores | 0.0 /100 | #312 | Tragic 9.2% |
| Americans | 0.0 /100 | #313 | Tragic 9.3% |
| Fijians | 0.0 /100 | #314 | Tragic 9.3% |
| Cherokee | 0.0 /100 | #315 | Tragic 9.3% |
| Houma | 0.0 /100 | #316 | Tragic 9.4% |
| Dutch West Indians | 0.0 /100 | #317 | Tragic 9.5% |
| Osage | 0.0 /100 | #318 | Tragic 9.5% |
| Marshallese | 0.0 /100 | #319 | Tragic 9.6% |
| Potawatomi | 0.0 /100 | #320 | Tragic 9.6% |
| Central American Indians | 0.0 /100 | #321 | Tragic 9.6% |
| Alaska Natives | 0.0 /100 | #322 | Tragic 9.6% |
| Immigrants | Bahamas | 0.0 /100 | #323 | Tragic 9.6% |
| Paiute | 0.0 /100 | #324 | Tragic 9.7% |
| Choctaw | 0.0 /100 | #325 | Tragic 9.8% |
| Delaware | 0.0 /100 | #326 | Tragic 9.8% |
Demographics Similar to Syrians by Unemployment Among Women with Children Under 6 years
In terms of unemployment among women with children under 6 years, the demographic groups most similar to Syrians are Immigrants from Austria (7.7%, a difference of 0.040%), Immigrants from Africa (7.7%, a difference of 0.040%), Slavic (7.7%, a difference of 0.040%), Malaysian (7.7%, a difference of 0.060%), and Immigrants from St. Vincent and the Grenadines (7.7%, a difference of 0.060%).
| Demographics | Rating | Rank | Unemployment Among Women with Children Under 6 years |
| Immigrants | Thailand | 38.5 /100 | #187 | Fair 7.7% |
| Czechoslovakians | 38.4 /100 | #188 | Fair 7.7% |
| Immigrants | Panama | 35.7 /100 | #189 | Fair 7.7% |
| Immigrants | North Macedonia | 34.4 /100 | #190 | Fair 7.7% |
| Immigrants | Austria | 32.4 /100 | #191 | Fair 7.7% |
| Immigrants | Africa | 32.4 /100 | #192 | Fair 7.7% |
| Slavs | 32.4 /100 | #193 | Fair 7.7% |
| Syrians | 31.9 /100 | #194 | Fair 7.7% |
| Malaysians | 31.1 /100 | #195 | Fair 7.7% |
| Immigrants | St. Vincent and the Grenadines | 31.1 /100 | #196 | Fair 7.7% |
| Italians | 30.4 /100 | #197 | Fair 7.7% |
| Lithuanians | 30.0 /100 | #198 | Fair 7.8% |
| Immigrants | Poland | 27.3 /100 | #199 | Fair 7.8% |
| Guamanians/Chamorros | 25.5 /100 | #200 | Fair 7.8% |
| Basques | 24.7 /100 | #201 | Fair 7.8% |