Malaysian vs Central American Female Unemployment
COMPARE
Malaysian
Central American
Female Unemployment
Female Unemployment Comparison
Malaysians
Central Americans
5.3%
FEMALE UNEMPLOYMENT
40.1/ 100
METRIC RATING
185th/ 347
METRIC RANK
5.9%
FEMALE UNEMPLOYMENT
0.0/ 100
METRIC RATING
271st/ 347
METRIC RANK
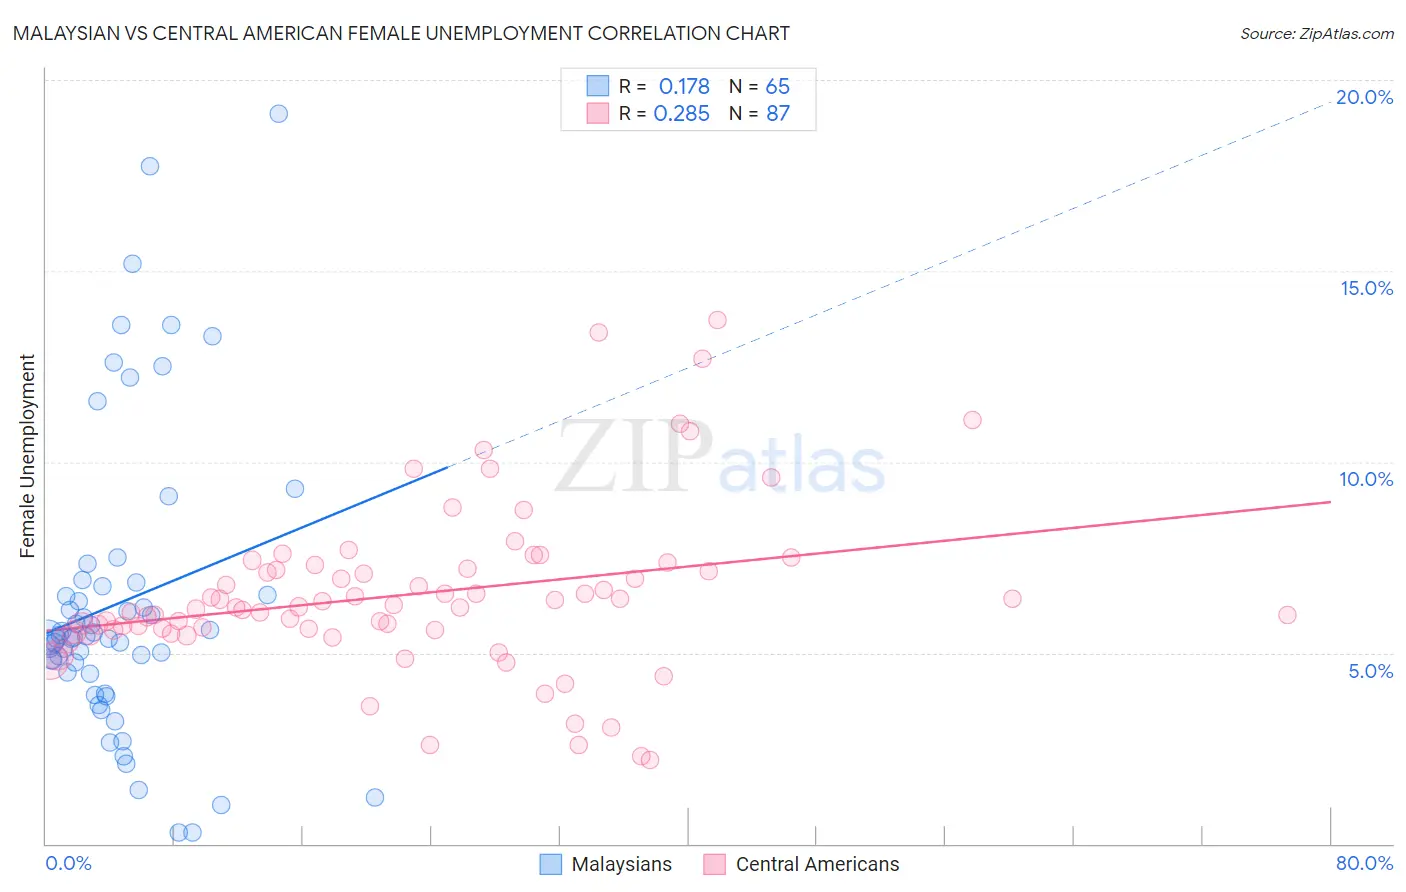
Malaysian vs Central American Female Unemployment Correlation Chart
The statistical analysis conducted on geographies consisting of 225,706,419 people shows a poor positive correlation between the proportion of Malaysians and unemploymnet rate among females in the United States with a correlation coefficient (R) of 0.178 and weighted average of 5.3%. Similarly, the statistical analysis conducted on geographies consisting of 499,975,290 people shows a weak positive correlation between the proportion of Central Americans and unemploymnet rate among females in the United States with a correlation coefficient (R) of 0.285 and weighted average of 5.9%, a difference of 12.2%.
Female Unemployment Correlation Summary
| Measurement | Malaysian | Central American |
| Minimum | 0.30% | 2.2% |
| Maximum | 19.1% | 13.7% |
| Range | 18.8% | 11.5% |
| Mean | 6.3% | 6.5% |
| Median | 5.4% | 6.2% |
| Interquartile 25% (IQ1) | 4.5% | 5.6% |
| Interquartile 75% (IQ3) | 6.8% | 7.2% |
| Interquartile Range (IQR) | 2.3% | 1.6% |
| Standard Deviation (Sample) | 3.9% | 2.2% |
| Standard Deviation (Population) | 3.9% | 2.2% |
Similar Demographics by Female Unemployment
Demographics Similar to Malaysians by Female Unemployment
In terms of female unemployment, the demographic groups most similar to Malaysians are Immigrants from Ukraine (5.3%, a difference of 0.010%), Immigrants from Indonesia (5.3%, a difference of 0.040%), Immigrants from Belarus (5.3%, a difference of 0.040%), Taiwanese (5.3%, a difference of 0.16%), and Nonimmigrants (5.3%, a difference of 0.16%).
| Demographics | Rating | Rank | Female Unemployment |
| Immigrants | Southern Europe | 46.2 /100 | #178 | Average 5.3% |
| Laotians | 45.1 /100 | #179 | Average 5.3% |
| Immigrants | Congo | 43.1 /100 | #180 | Average 5.3% |
| Taiwanese | 42.7 /100 | #181 | Average 5.3% |
| Immigrants | Nonimmigrants | 42.6 /100 | #182 | Average 5.3% |
| Immigrants | Indonesia | 40.7 /100 | #183 | Average 5.3% |
| Immigrants | Ukraine | 40.1 /100 | #184 | Average 5.3% |
| Malaysians | 40.1 /100 | #185 | Average 5.3% |
| Immigrants | Belarus | 39.4 /100 | #186 | Fair 5.3% |
| Immigrants | Albania | 35.4 /100 | #187 | Fair 5.3% |
| Afghans | 33.9 /100 | #188 | Fair 5.3% |
| Costa Ricans | 33.8 /100 | #189 | Fair 5.3% |
| Ugandans | 31.2 /100 | #190 | Fair 5.3% |
| Cherokee | 30.8 /100 | #191 | Fair 5.3% |
| Portuguese | 28.6 /100 | #192 | Fair 5.3% |
Demographics Similar to Central Americans by Female Unemployment
In terms of female unemployment, the demographic groups most similar to Central Americans are Immigrants from Honduras (5.9%, a difference of 0.10%), Lumbee (5.9%, a difference of 0.19%), Ghanaian (5.9%, a difference of 0.20%), African (5.9%, a difference of 0.28%), and Immigrants from Western Africa (5.9%, a difference of 0.51%).
| Demographics | Rating | Rank | Female Unemployment |
| Immigrants | Bahamas | 0.1 /100 | #264 | Tragic 5.8% |
| Blackfeet | 0.0 /100 | #265 | Tragic 5.9% |
| Cape Verdeans | 0.0 /100 | #266 | Tragic 5.9% |
| Nepalese | 0.0 /100 | #267 | Tragic 5.9% |
| Hondurans | 0.0 /100 | #268 | Tragic 5.9% |
| Immigrants | Western Africa | 0.0 /100 | #269 | Tragic 5.9% |
| Immigrants | Honduras | 0.0 /100 | #270 | Tragic 5.9% |
| Central Americans | 0.0 /100 | #271 | Tragic 5.9% |
| Lumbee | 0.0 /100 | #272 | Tragic 5.9% |
| Ghanaians | 0.0 /100 | #273 | Tragic 5.9% |
| Africans | 0.0 /100 | #274 | Tragic 5.9% |
| Senegalese | 0.0 /100 | #275 | Tragic 6.0% |
| Bahamians | 0.0 /100 | #276 | Tragic 6.0% |
| Immigrants | Ghana | 0.0 /100 | #277 | Tragic 6.0% |
| Yaqui | 0.0 /100 | #278 | Tragic 6.0% |