Immigrants from Western Europe vs Spaniard Unemployment
COMPARE
Immigrants from Western Europe
Spaniard
Unemployment
Unemployment Comparison
Immigrants from Western Europe
Spaniards
5.1%
UNEMPLOYMENT
91.1/ 100
METRIC RATING
115th/ 347
METRIC RANK
5.3%
UNEMPLOYMENT
42.2/ 100
METRIC RATING
182nd/ 347
METRIC RANK
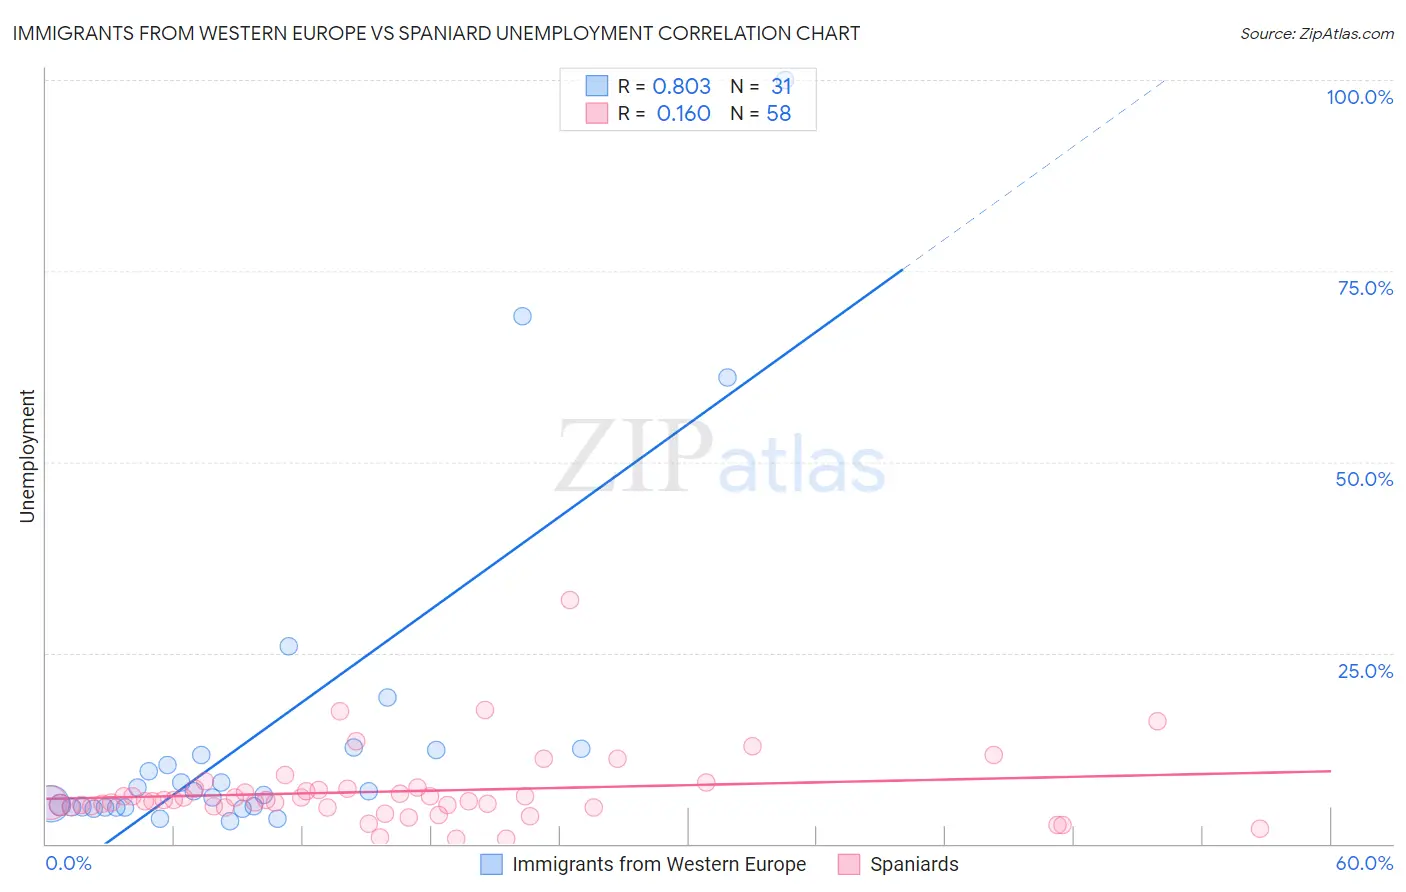
Immigrants from Western Europe vs Spaniard Unemployment Correlation Chart
The statistical analysis conducted on geographies consisting of 492,944,202 people shows a very strong positive correlation between the proportion of Immigrants from Western Europe and unemployment in the United States with a correlation coefficient (R) of 0.803 and weighted average of 5.1%. Similarly, the statistical analysis conducted on geographies consisting of 442,859,385 people shows a poor positive correlation between the proportion of Spaniards and unemployment in the United States with a correlation coefficient (R) of 0.160 and weighted average of 5.3%, a difference of 4.2%.
Unemployment Correlation Summary
| Measurement | Immigrants from Western Europe | Spaniard |
| Minimum | 2.9% | 0.70% |
| Maximum | 100.0% | 31.9% |
| Range | 97.1% | 31.2% |
| Mean | 14.5% | 6.8% |
| Median | 6.8% | 5.7% |
| Interquartile 25% (IQ1) | 4.8% | 4.9% |
| Interquartile 75% (IQ3) | 12.2% | 7.2% |
| Interquartile Range (IQR) | 7.4% | 2.3% |
| Standard Deviation (Sample) | 21.9% | 4.9% |
| Standard Deviation (Population) | 21.5% | 4.9% |
Similar Demographics by Unemployment
Demographics Similar to Immigrants from Western Europe by Unemployment
In terms of unemployment, the demographic groups most similar to Immigrants from Western Europe are Immigrants from Sri Lanka (5.1%, a difference of 0.010%), Immigrants from Malaysia (5.1%, a difference of 0.030%), Immigrants from Germany (5.1%, a difference of 0.070%), Immigrants from Ireland (5.1%, a difference of 0.21%), and Argentinean (5.1%, a difference of 0.27%).
| Demographics | Rating | Rank | Unemployment |
| Immigrants | Kuwait | 93.7 /100 | #108 | Exceptional 5.0% |
| Immigrants | Eritrea | 93.3 /100 | #109 | Exceptional 5.0% |
| Immigrants | Lithuania | 93.2 /100 | #110 | Exceptional 5.0% |
| Chileans | 93.2 /100 | #111 | Exceptional 5.0% |
| South Africans | 92.6 /100 | #112 | Exceptional 5.1% |
| Argentineans | 92.4 /100 | #113 | Exceptional 5.1% |
| Immigrants | Ireland | 92.1 /100 | #114 | Exceptional 5.1% |
| Immigrants | Western Europe | 91.1 /100 | #115 | Exceptional 5.1% |
| Immigrants | Sri Lanka | 91.1 /100 | #116 | Exceptional 5.1% |
| Immigrants | Malaysia | 91.0 /100 | #117 | Exceptional 5.1% |
| Immigrants | Germany | 90.8 /100 | #118 | Exceptional 5.1% |
| Immigrants | France | 89.7 /100 | #119 | Excellent 5.1% |
| Macedonians | 89.7 /100 | #120 | Excellent 5.1% |
| Lebanese | 89.2 /100 | #121 | Excellent 5.1% |
| Immigrants | Switzerland | 89.1 /100 | #122 | Excellent 5.1% |
Demographics Similar to Spaniards by Unemployment
In terms of unemployment, the demographic groups most similar to Spaniards are Albanian (5.3%, a difference of 0.080%), Brazilian (5.3%, a difference of 0.13%), Immigrants from Greece (5.3%, a difference of 0.18%), Assyrian/Chaldean/Syriac (5.3%, a difference of 0.19%), and Immigrants from Thailand (5.3%, a difference of 0.21%).
| Demographics | Rating | Rank | Unemployment |
| Taiwanese | 49.6 /100 | #175 | Average 5.3% |
| Nicaraguans | 48.7 /100 | #176 | Average 5.3% |
| Immigrants | Nonimmigrants | 47.9 /100 | #177 | Average 5.3% |
| Afghans | 47.4 /100 | #178 | Average 5.3% |
| Malaysians | 46.8 /100 | #179 | Average 5.3% |
| Immigrants | Greece | 45.0 /100 | #180 | Average 5.3% |
| Albanians | 43.5 /100 | #181 | Average 5.3% |
| Spaniards | 42.2 /100 | #182 | Average 5.3% |
| Brazilians | 40.2 /100 | #183 | Average 5.3% |
| Assyrians/Chaldeans/Syriacs | 39.2 /100 | #184 | Fair 5.3% |
| Immigrants | Thailand | 38.9 /100 | #185 | Fair 5.3% |
| Immigrants | Uganda | 37.8 /100 | #186 | Fair 5.3% |
| Costa Ricans | 37.4 /100 | #187 | Fair 5.3% |
| Alsatians | 37.0 /100 | #188 | Fair 5.3% |
| Immigrants | Belarus | 35.6 /100 | #189 | Fair 5.3% |