German Russian vs Immigrants from North America Unemployment
COMPARE
German Russian
Immigrants from North America
Unemployment
Unemployment Comparison
German Russians
Immigrants from North America
4.9%
UNEMPLOYMENT
98.0/ 100
METRIC RATING
76th/ 347
METRIC RANK
4.9%
UNEMPLOYMENT
98.5/ 100
METRIC RATING
69th/ 347
METRIC RANK
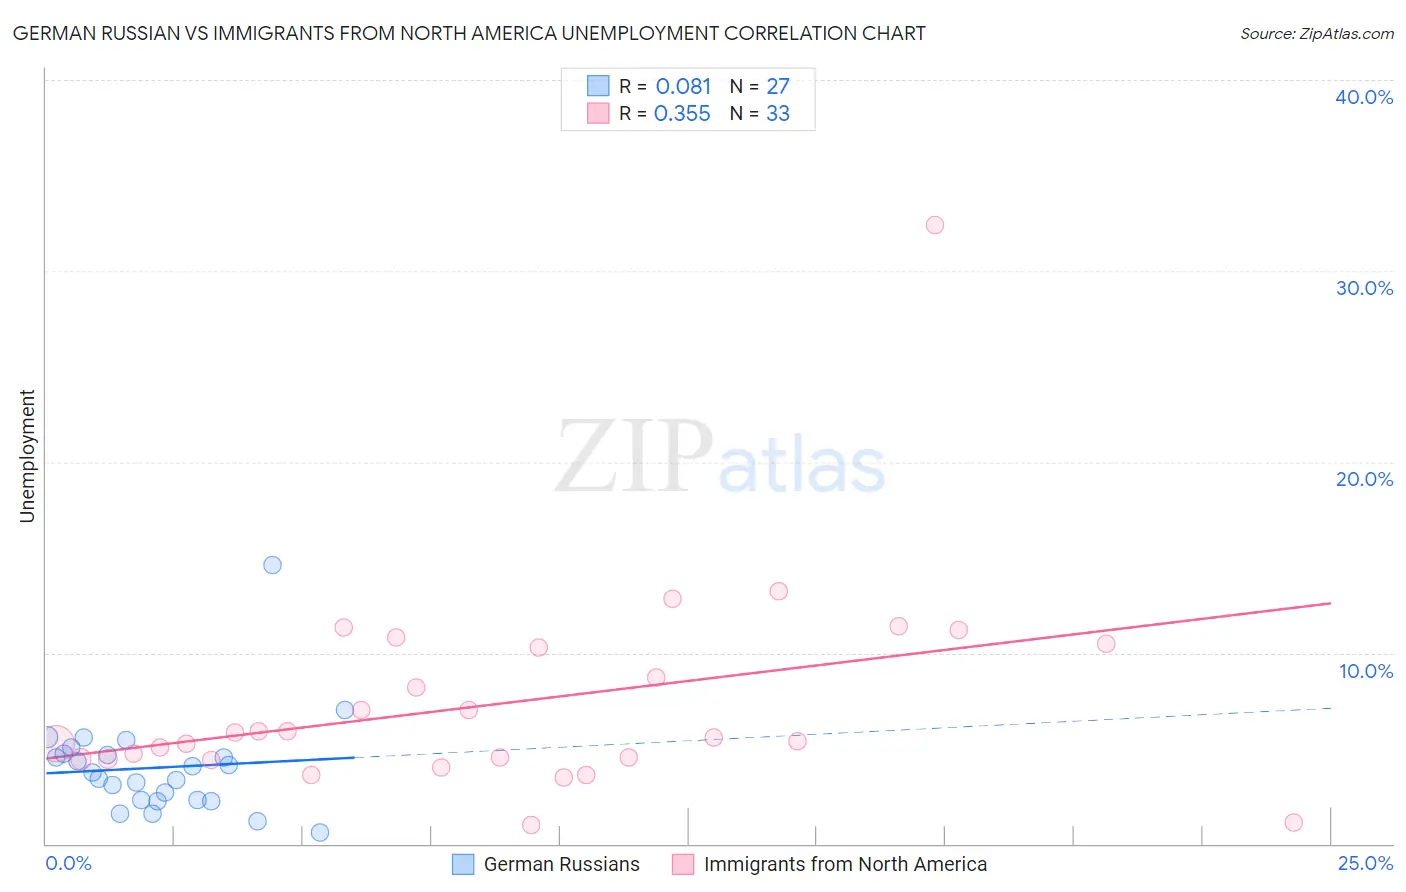
German Russian vs Immigrants from North America Unemployment Correlation Chart
The statistical analysis conducted on geographies consisting of 96,379,174 people shows a slight positive correlation between the proportion of German Russians and unemployment in the United States with a correlation coefficient (R) of 0.081 and weighted average of 4.9%. Similarly, the statistical analysis conducted on geographies consisting of 461,564,584 people shows a mild positive correlation between the proportion of Immigrants from North America and unemployment in the United States with a correlation coefficient (R) of 0.355 and weighted average of 4.9%, a difference of 0.53%.
Unemployment Correlation Summary
| Measurement | German Russian | Immigrants from North America |
| Minimum | 0.60% | 1.0% |
| Maximum | 14.6% | 32.4% |
| Range | 14.0% | 31.4% |
| Mean | 4.0% | 7.4% |
| Median | 3.8% | 5.6% |
| Interquartile 25% (IQ1) | 2.3% | 4.4% |
| Interquartile 75% (IQ3) | 4.7% | 10.4% |
| Interquartile Range (IQR) | 2.4% | 5.9% |
| Standard Deviation (Sample) | 2.6% | 5.5% |
| Standard Deviation (Population) | 2.6% | 5.5% |
Demographics Similar to German Russians and Immigrants from North America by Unemployment
In terms of unemployment, the demographic groups most similar to German Russians are Turkish (4.9%, a difference of 0.030%), Cypriot (4.9%, a difference of 0.060%), Okinawan (4.9%, a difference of 0.10%), Immigrants from Northern Europe (4.9%, a difference of 0.16%), and Canadian (5.0%, a difference of 0.22%). Similarly, the demographic groups most similar to Immigrants from North America are Slavic (4.9%, a difference of 0.090%), New Zealander (4.9%, a difference of 0.12%), Serbian (4.9%, a difference of 0.15%), Slovak (4.9%, a difference of 0.16%), and Immigrants from Japan (4.9%, a difference of 0.21%).
| Demographics | Rating | Rank | Unemployment |
| Icelanders | 98.9 /100 | #62 | Exceptional 4.9% |
| Immigrants | Bulgaria | 98.9 /100 | #63 | Exceptional 4.9% |
| Italians | 98.9 /100 | #64 | Exceptional 4.9% |
| Immigrants | Canada | 98.8 /100 | #65 | Exceptional 4.9% |
| Slovaks | 98.7 /100 | #66 | Exceptional 4.9% |
| New Zealanders | 98.6 /100 | #67 | Exceptional 4.9% |
| Slavs | 98.6 /100 | #68 | Exceptional 4.9% |
| Immigrants | North America | 98.5 /100 | #69 | Exceptional 4.9% |
| Serbians | 98.4 /100 | #70 | Exceptional 4.9% |
| Immigrants | Japan | 98.3 /100 | #71 | Exceptional 4.9% |
| Burmese | 98.3 /100 | #72 | Exceptional 4.9% |
| Paraguayans | 98.3 /100 | #73 | Exceptional 4.9% |
| Immigrants | Northern Europe | 98.2 /100 | #74 | Exceptional 4.9% |
| Turks | 98.0 /100 | #75 | Exceptional 4.9% |
| German Russians | 98.0 /100 | #76 | Exceptional 4.9% |
| Cypriots | 97.9 /100 | #77 | Exceptional 4.9% |
| Okinawans | 97.9 /100 | #78 | Exceptional 4.9% |
| Canadians | 97.7 /100 | #79 | Exceptional 5.0% |
| Immigrants | Sweden | 97.6 /100 | #80 | Exceptional 5.0% |
| Basques | 97.6 /100 | #81 | Exceptional 5.0% |
| Fijians | 97.6 /100 | #82 | Exceptional 5.0% |