Immigrants from Korea vs Immigrants from North America Unemployment
COMPARE
Immigrants from Korea
Immigrants from North America
Unemployment
Unemployment Comparison
Immigrants from Korea
Immigrants from North America
5.0%
UNEMPLOYMENT
96.6/ 100
METRIC RATING
88th/ 347
METRIC RANK
4.9%
UNEMPLOYMENT
98.5/ 100
METRIC RATING
69th/ 347
METRIC RANK
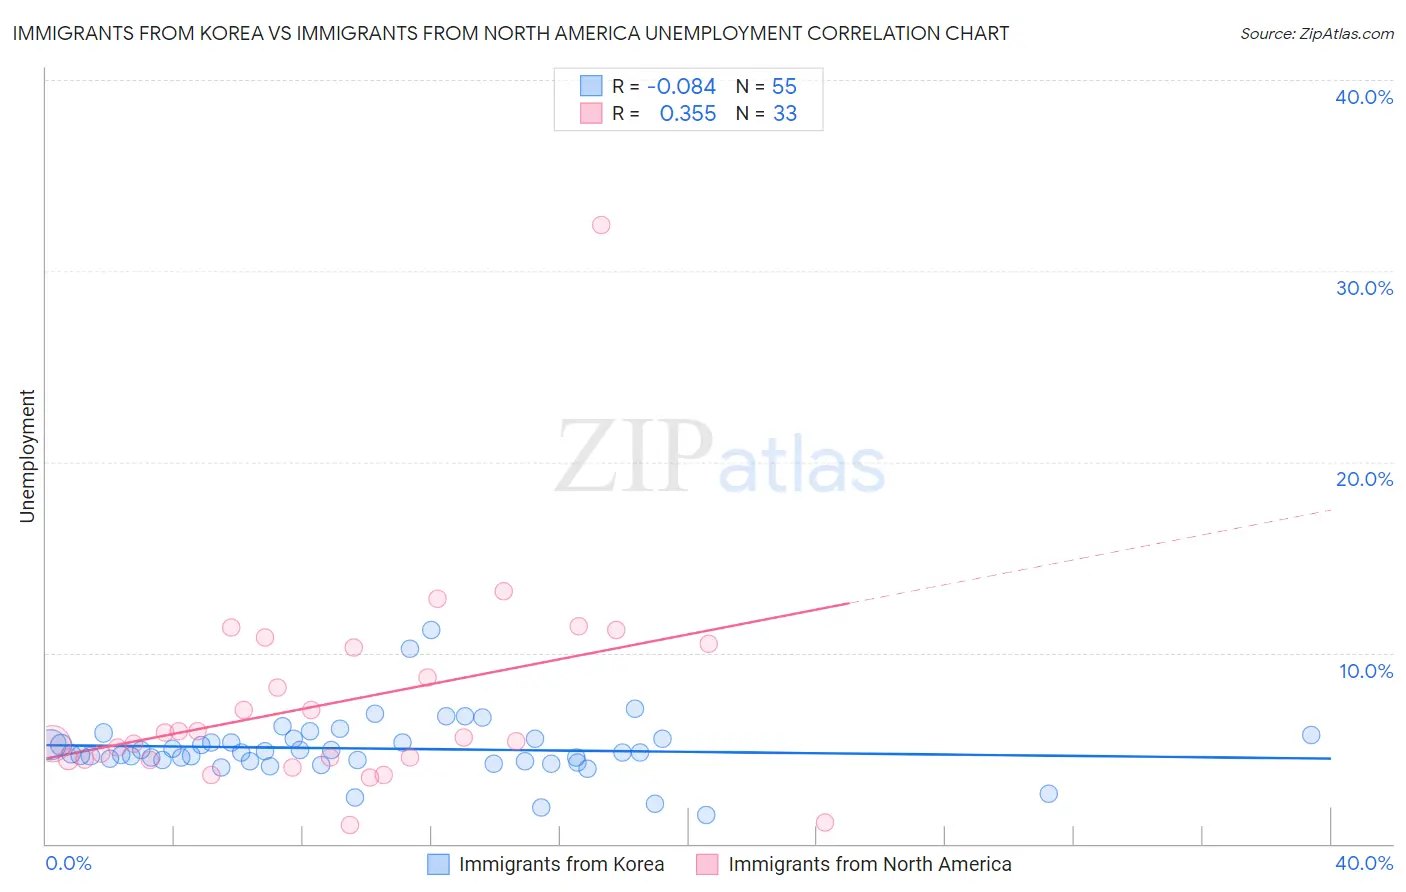
Immigrants from Korea vs Immigrants from North America Unemployment Correlation Chart
The statistical analysis conducted on geographies consisting of 415,935,417 people shows a slight negative correlation between the proportion of Immigrants from Korea and unemployment in the United States with a correlation coefficient (R) of -0.084 and weighted average of 5.0%. Similarly, the statistical analysis conducted on geographies consisting of 461,564,584 people shows a mild positive correlation between the proportion of Immigrants from North America and unemployment in the United States with a correlation coefficient (R) of 0.355 and weighted average of 4.9%, a difference of 1.4%.
Unemployment Correlation Summary
| Measurement | Immigrants from Korea | Immigrants from North America |
| Minimum | 1.5% | 1.0% |
| Maximum | 11.2% | 32.4% |
| Range | 9.7% | 31.4% |
| Mean | 5.0% | 7.4% |
| Median | 4.8% | 5.6% |
| Interquartile 25% (IQ1) | 4.3% | 4.4% |
| Interquartile 75% (IQ3) | 5.5% | 10.4% |
| Interquartile Range (IQR) | 1.2% | 5.9% |
| Standard Deviation (Sample) | 1.6% | 5.5% |
| Standard Deviation (Population) | 1.6% | 5.5% |
Demographics Similar to Immigrants from Korea and Immigrants from North America by Unemployment
In terms of unemployment, the demographic groups most similar to Immigrants from Korea are Immigrants from Moldova (5.0%, a difference of 0.030%), Hungarian (5.0%, a difference of 0.18%), Immigrants from Australia (5.0%, a difference of 0.21%), Russian (5.0%, a difference of 0.49%), and Hmong (5.0%, a difference of 0.57%). Similarly, the demographic groups most similar to Immigrants from North America are Slavic (4.9%, a difference of 0.090%), Serbian (4.9%, a difference of 0.15%), Immigrants from Japan (4.9%, a difference of 0.21%), Burmese (4.9%, a difference of 0.23%), and Paraguayan (4.9%, a difference of 0.27%).
| Demographics | Rating | Rank | Unemployment |
| Slavs | 98.6 /100 | #68 | Exceptional 4.9% |
| Immigrants | North America | 98.5 /100 | #69 | Exceptional 4.9% |
| Serbians | 98.4 /100 | #70 | Exceptional 4.9% |
| Immigrants | Japan | 98.3 /100 | #71 | Exceptional 4.9% |
| Burmese | 98.3 /100 | #72 | Exceptional 4.9% |
| Paraguayans | 98.3 /100 | #73 | Exceptional 4.9% |
| Immigrants | Northern Europe | 98.2 /100 | #74 | Exceptional 4.9% |
| Turks | 98.0 /100 | #75 | Exceptional 4.9% |
| German Russians | 98.0 /100 | #76 | Exceptional 4.9% |
| Cypriots | 97.9 /100 | #77 | Exceptional 4.9% |
| Okinawans | 97.9 /100 | #78 | Exceptional 4.9% |
| Canadians | 97.7 /100 | #79 | Exceptional 5.0% |
| Immigrants | Sweden | 97.6 /100 | #80 | Exceptional 5.0% |
| Basques | 97.6 /100 | #81 | Exceptional 5.0% |
| Fijians | 97.6 /100 | #82 | Exceptional 5.0% |
| Hmong | 97.6 /100 | #83 | Exceptional 5.0% |
| Russians | 97.4 /100 | #84 | Exceptional 5.0% |
| Immigrants | Australia | 97.0 /100 | #85 | Exceptional 5.0% |
| Hungarians | 96.9 /100 | #86 | Exceptional 5.0% |
| Immigrants | Moldova | 96.6 /100 | #87 | Exceptional 5.0% |
| Immigrants | Korea | 96.6 /100 | #88 | Exceptional 5.0% |