Egyptian vs Immigrants from North America Unemployment
COMPARE
Egyptian
Immigrants from North America
Unemployment
Unemployment Comparison
Egyptians
Immigrants from North America
5.2%
UNEMPLOYMENT
75.2/ 100
METRIC RATING
153rd/ 347
METRIC RANK
4.9%
UNEMPLOYMENT
98.5/ 100
METRIC RATING
69th/ 347
METRIC RANK
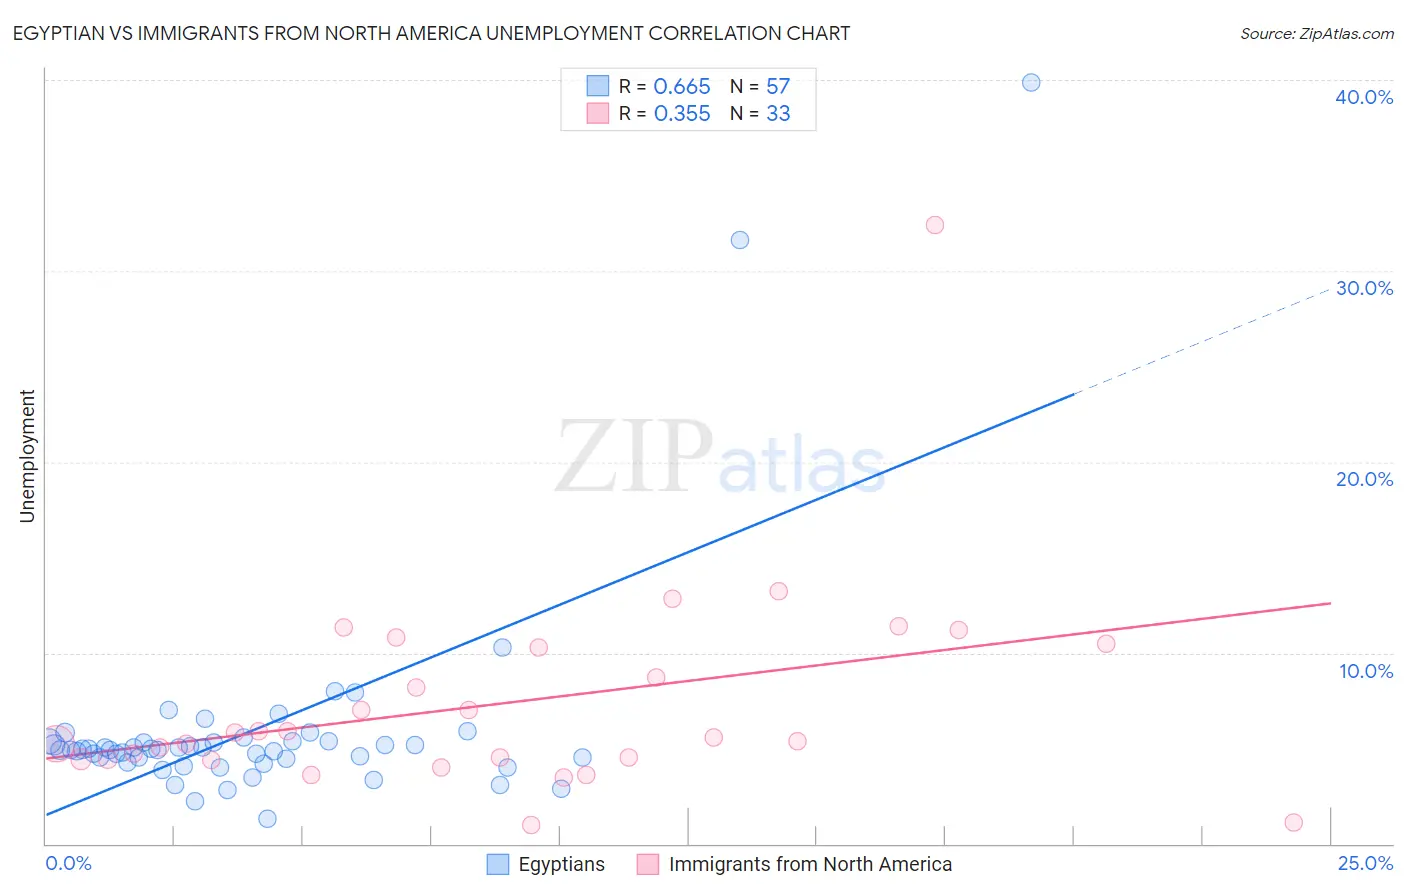
Egyptian vs Immigrants from North America Unemployment Correlation Chart
The statistical analysis conducted on geographies consisting of 276,825,102 people shows a significant positive correlation between the proportion of Egyptians and unemployment in the United States with a correlation coefficient (R) of 0.665 and weighted average of 5.2%. Similarly, the statistical analysis conducted on geographies consisting of 461,564,584 people shows a mild positive correlation between the proportion of Immigrants from North America and unemployment in the United States with a correlation coefficient (R) of 0.355 and weighted average of 4.9%, a difference of 5.1%.
Unemployment Correlation Summary
| Measurement | Egyptian | Immigrants from North America |
| Minimum | 1.3% | 1.0% |
| Maximum | 39.9% | 32.4% |
| Range | 38.6% | 31.4% |
| Mean | 6.0% | 7.4% |
| Median | 4.9% | 5.6% |
| Interquartile 25% (IQ1) | 4.4% | 4.4% |
| Interquartile 75% (IQ3) | 5.4% | 10.4% |
| Interquartile Range (IQR) | 1.0% | 5.9% |
| Standard Deviation (Sample) | 5.9% | 5.5% |
| Standard Deviation (Population) | 5.9% | 5.5% |
Similar Demographics by Unemployment
Demographics Similar to Egyptians by Unemployment
In terms of unemployment, the demographic groups most similar to Egyptians are Immigrants from Hong Kong (5.2%, a difference of 0.0%), Immigrants from Eastern Europe (5.2%, a difference of 0.010%), Immigrants from China (5.2%, a difference of 0.040%), Potawatomi (5.2%, a difference of 0.080%), and Syrian (5.2%, a difference of 0.22%).
| Demographics | Rating | Rank | Unemployment |
| Immigrants | Asia | 81.8 /100 | #146 | Excellent 5.1% |
| Indians (Asian) | 81.6 /100 | #147 | Excellent 5.1% |
| Immigrants | Italy | 79.1 /100 | #148 | Good 5.1% |
| Syrians | 77.7 /100 | #149 | Good 5.2% |
| Potawatomi | 76.2 /100 | #150 | Good 5.2% |
| Immigrants | Eastern Europe | 75.3 /100 | #151 | Good 5.2% |
| Immigrants | Hong Kong | 75.2 /100 | #152 | Good 5.2% |
| Egyptians | 75.2 /100 | #153 | Good 5.2% |
| Immigrants | China | 74.7 /100 | #154 | Good 5.2% |
| Immigrants | Northern Africa | 71.3 /100 | #155 | Good 5.2% |
| Immigrants | Kazakhstan | 70.4 /100 | #156 | Good 5.2% |
| Sri Lankans | 69.5 /100 | #157 | Good 5.2% |
| Immigrants | Egypt | 66.7 /100 | #158 | Good 5.2% |
| Immigrants | Russia | 66.6 /100 | #159 | Good 5.2% |
| Laotians | 66.3 /100 | #160 | Good 5.2% |
Demographics Similar to Immigrants from North America by Unemployment
In terms of unemployment, the demographic groups most similar to Immigrants from North America are Slavic (4.9%, a difference of 0.090%), New Zealander (4.9%, a difference of 0.12%), Serbian (4.9%, a difference of 0.15%), Slovak (4.9%, a difference of 0.16%), and Immigrants from Japan (4.9%, a difference of 0.21%).
| Demographics | Rating | Rank | Unemployment |
| Icelanders | 98.9 /100 | #62 | Exceptional 4.9% |
| Immigrants | Bulgaria | 98.9 /100 | #63 | Exceptional 4.9% |
| Italians | 98.9 /100 | #64 | Exceptional 4.9% |
| Immigrants | Canada | 98.8 /100 | #65 | Exceptional 4.9% |
| Slovaks | 98.7 /100 | #66 | Exceptional 4.9% |
| New Zealanders | 98.6 /100 | #67 | Exceptional 4.9% |
| Slavs | 98.6 /100 | #68 | Exceptional 4.9% |
| Immigrants | North America | 98.5 /100 | #69 | Exceptional 4.9% |
| Serbians | 98.4 /100 | #70 | Exceptional 4.9% |
| Immigrants | Japan | 98.3 /100 | #71 | Exceptional 4.9% |
| Burmese | 98.3 /100 | #72 | Exceptional 4.9% |
| Paraguayans | 98.3 /100 | #73 | Exceptional 4.9% |
| Immigrants | Northern Europe | 98.2 /100 | #74 | Exceptional 4.9% |
| Turks | 98.0 /100 | #75 | Exceptional 4.9% |
| German Russians | 98.0 /100 | #76 | Exceptional 4.9% |