Immigrants from Cameroon vs Cuban Unemployment
COMPARE
Immigrants from Cameroon
Cuban
Unemployment
Unemployment Comparison
Immigrants from Cameroon
Cubans
5.6%
UNEMPLOYMENT
1.0/ 100
METRIC RATING
247th/ 347
METRIC RANK
4.7%
UNEMPLOYMENT
99.8/ 100
METRIC RATING
28th/ 347
METRIC RANK
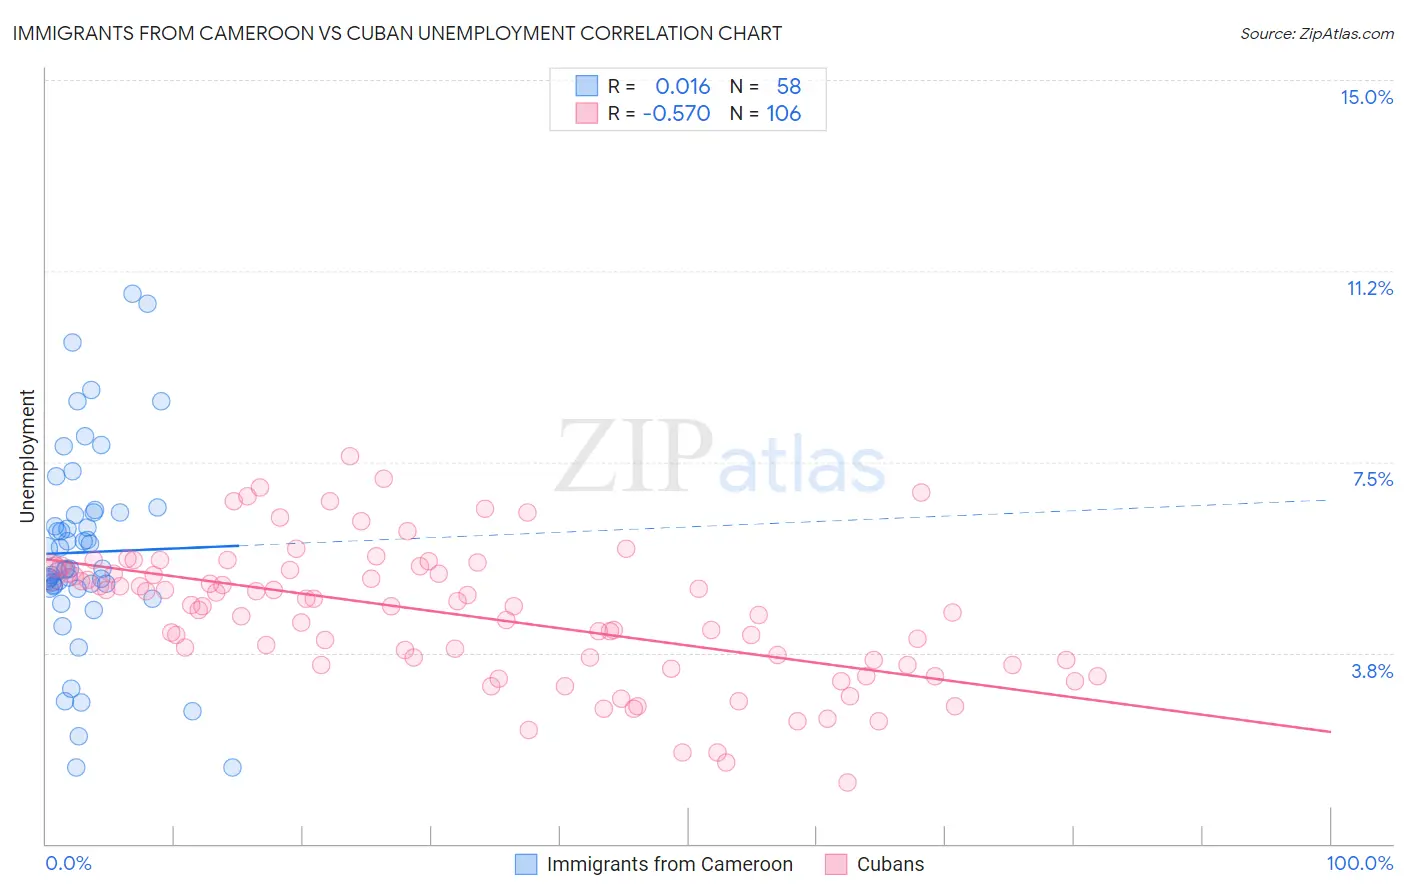
Immigrants from Cameroon vs Cuban Unemployment Correlation Chart
The statistical analysis conducted on geographies consisting of 130,734,727 people shows no correlation between the proportion of Immigrants from Cameroon and unemployment in the United States with a correlation coefficient (R) of 0.016 and weighted average of 5.6%. Similarly, the statistical analysis conducted on geographies consisting of 448,752,139 people shows a substantial negative correlation between the proportion of Cubans and unemployment in the United States with a correlation coefficient (R) of -0.570 and weighted average of 4.7%, a difference of 18.7%.
Unemployment Correlation Summary
| Measurement | Immigrants from Cameroon | Cuban |
| Minimum | 1.5% | 1.2% |
| Maximum | 10.8% | 7.6% |
| Range | 9.3% | 6.4% |
| Mean | 5.7% | 4.5% |
| Median | 5.4% | 4.7% |
| Interquartile 25% (IQ1) | 5.1% | 3.5% |
| Interquartile 75% (IQ3) | 6.5% | 5.3% |
| Interquartile Range (IQR) | 1.4% | 1.8% |
| Standard Deviation (Sample) | 1.9% | 1.3% |
| Standard Deviation (Population) | 1.9% | 1.3% |
Similar Demographics by Unemployment
Demographics Similar to Immigrants from Cameroon by Unemployment
In terms of unemployment, the demographic groups most similar to Immigrants from Cameroon are Liberian (5.6%, a difference of 0.13%), Bermudan (5.6%, a difference of 0.15%), French American Indian (5.6%, a difference of 0.19%), Dutch West Indian (5.6%, a difference of 0.21%), and Marshallese (5.6%, a difference of 0.36%).
| Demographics | Rating | Rank | Unemployment |
| Cree | 2.6 /100 | #240 | Tragic 5.6% |
| Tlingit-Haida | 2.0 /100 | #241 | Tragic 5.6% |
| Spanish Americans | 2.0 /100 | #242 | Tragic 5.6% |
| Marshallese | 1.3 /100 | #243 | Tragic 5.6% |
| Dutch West Indians | 1.2 /100 | #244 | Tragic 5.6% |
| French American Indians | 1.2 /100 | #245 | Tragic 5.6% |
| Bermudans | 1.1 /100 | #246 | Tragic 5.6% |
| Immigrants | Cameroon | 1.0 /100 | #247 | Tragic 5.6% |
| Liberians | 0.9 /100 | #248 | Tragic 5.6% |
| Cajuns | 0.8 /100 | #249 | Tragic 5.6% |
| Japanese | 0.8 /100 | #250 | Tragic 5.6% |
| Kiowa | 0.6 /100 | #251 | Tragic 5.7% |
| Hondurans | 0.3 /100 | #252 | Tragic 5.7% |
| Central Americans | 0.3 /100 | #253 | Tragic 5.7% |
| Immigrants | Honduras | 0.3 /100 | #254 | Tragic 5.7% |
Demographics Similar to Cubans by Unemployment
In terms of unemployment, the demographic groups most similar to Cubans are Polish (4.7%, a difference of 0.12%), Finnish (4.7%, a difference of 0.32%), Irish (4.8%, a difference of 0.36%), Croatian (4.8%, a difference of 0.38%), and Zimbabwean (4.8%, a difference of 0.48%).
| Demographics | Rating | Rank | Unemployment |
| Welsh | 99.9 /100 | #21 | Exceptional 4.7% |
| Thais | 99.9 /100 | #22 | Exceptional 4.7% |
| British | 99.9 /100 | #23 | Exceptional 4.7% |
| Venezuelans | 99.9 /100 | #24 | Exceptional 4.7% |
| Latvians | 99.9 /100 | #25 | Exceptional 4.7% |
| Bulgarians | 99.9 /100 | #26 | Exceptional 4.7% |
| Finns | 99.9 /100 | #27 | Exceptional 4.7% |
| Cubans | 99.8 /100 | #28 | Exceptional 4.7% |
| Poles | 99.8 /100 | #29 | Exceptional 4.7% |
| Irish | 99.8 /100 | #30 | Exceptional 4.8% |
| Croatians | 99.8 /100 | #31 | Exceptional 4.8% |
| Zimbabweans | 99.8 /100 | #32 | Exceptional 4.8% |
| Sudanese | 99.8 /100 | #33 | Exceptional 4.8% |
| Immigrants | Bolivia | 99.8 /100 | #34 | Exceptional 4.8% |
| Scotch-Irish | 99.8 /100 | #35 | Exceptional 4.8% |