Immigrants from Iraq vs German Russian Female Unemployment
COMPARE
Immigrants from Iraq
German Russian
Female Unemployment
Female Unemployment Comparison
Immigrants from Iraq
German Russians
5.5%
FEMALE UNEMPLOYMENT
3.9/ 100
METRIC RATING
231st/ 347
METRIC RANK
4.9%
FEMALE UNEMPLOYMENT
98.1/ 100
METRIC RATING
71st/ 347
METRIC RANK
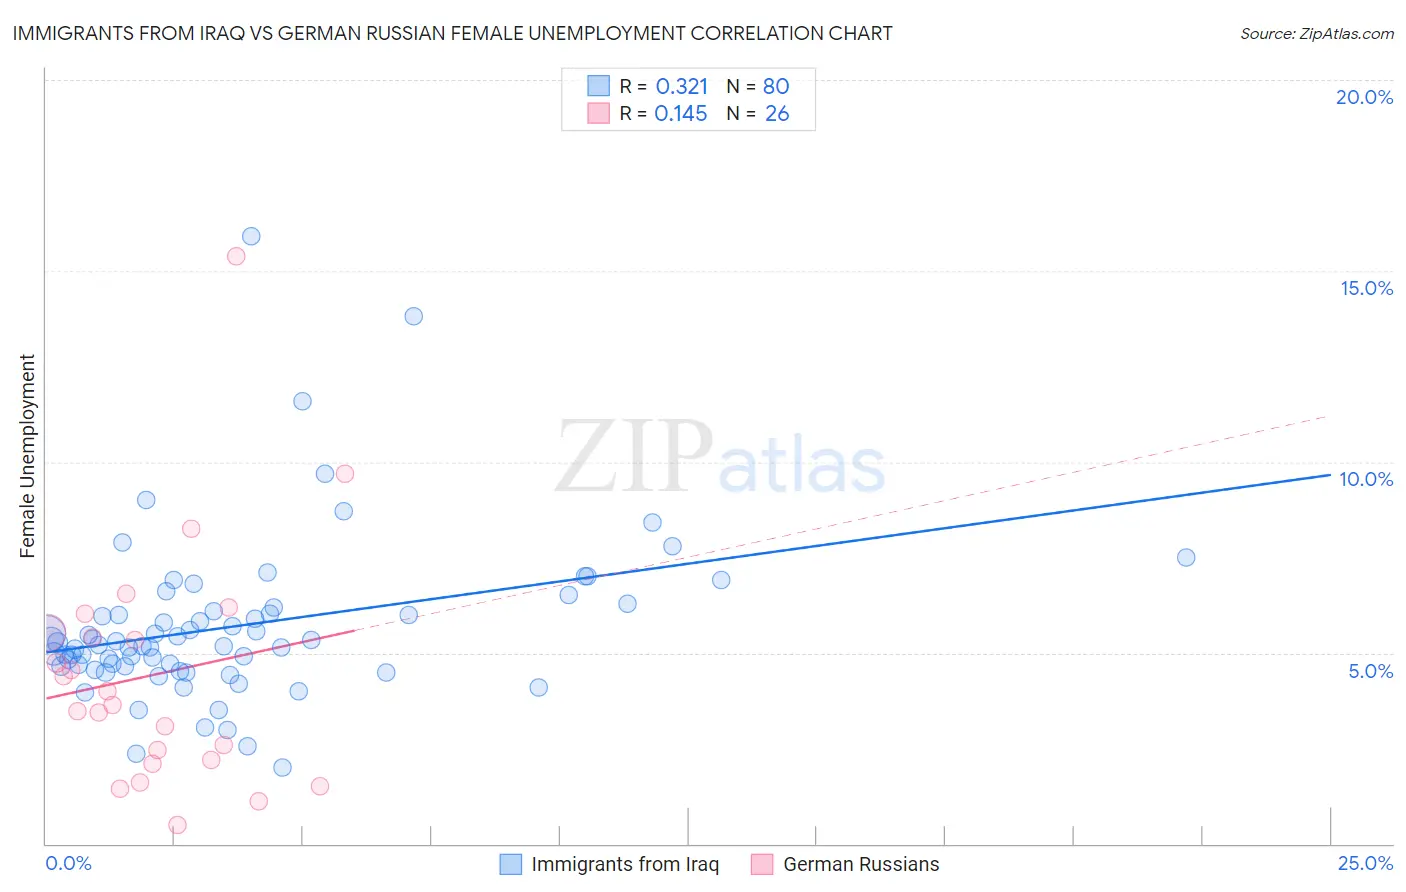
Immigrants from Iraq vs German Russian Female Unemployment Correlation Chart
The statistical analysis conducted on geographies consisting of 194,592,828 people shows a mild positive correlation between the proportion of Immigrants from Iraq and unemploymnet rate among females in the United States with a correlation coefficient (R) of 0.321 and weighted average of 5.5%. Similarly, the statistical analysis conducted on geographies consisting of 96,182,011 people shows a poor positive correlation between the proportion of German Russians and unemploymnet rate among females in the United States with a correlation coefficient (R) of 0.145 and weighted average of 4.9%, a difference of 11.4%.
Female Unemployment Correlation Summary
| Measurement | Immigrants from Iraq | German Russian |
| Minimum | 2.0% | 0.50% |
| Maximum | 15.9% | 15.4% |
| Range | 13.9% | 14.9% |
| Mean | 5.7% | 4.4% |
| Median | 5.2% | 3.8% |
| Interquartile 25% (IQ1) | 4.7% | 2.2% |
| Interquartile 75% (IQ3) | 6.1% | 5.5% |
| Interquartile Range (IQR) | 1.5% | 3.3% |
| Standard Deviation (Sample) | 2.2% | 3.2% |
| Standard Deviation (Population) | 2.1% | 3.1% |
Similar Demographics by Female Unemployment
Demographics Similar to Immigrants from Iraq by Female Unemployment
In terms of female unemployment, the demographic groups most similar to Immigrants from Iraq are Liberian (5.5%, a difference of 0.010%), Moroccan (5.5%, a difference of 0.21%), Immigrants from Lebanon (5.5%, a difference of 0.24%), Immigrants from Iran (5.5%, a difference of 0.24%), and Immigrants from Uruguay (5.5%, a difference of 0.27%).
| Demographics | Rating | Rank | Female Unemployment |
| Iraqis | 7.1 /100 | #224 | Tragic 5.5% |
| French American Indians | 6.1 /100 | #225 | Tragic 5.5% |
| Immigrants | Peru | 5.9 /100 | #226 | Tragic 5.5% |
| Immigrants | Philippines | 5.3 /100 | #227 | Tragic 5.5% |
| Israelis | 4.8 /100 | #228 | Tragic 5.5% |
| Panamanians | 4.7 /100 | #229 | Tragic 5.5% |
| Immigrants | Uruguay | 4.7 /100 | #230 | Tragic 5.5% |
| Immigrants | Iraq | 3.9 /100 | #231 | Tragic 5.5% |
| Liberians | 3.9 /100 | #232 | Tragic 5.5% |
| Moroccans | 3.4 /100 | #233 | Tragic 5.5% |
| Immigrants | Lebanon | 3.3 /100 | #234 | Tragic 5.5% |
| Immigrants | Iran | 3.3 /100 | #235 | Tragic 5.5% |
| Immigrants | Cambodia | 3.3 /100 | #236 | Tragic 5.5% |
| Immigrants | Panama | 3.2 /100 | #237 | Tragic 5.5% |
| Sierra Leoneans | 3.2 /100 | #238 | Tragic 5.5% |
Demographics Similar to German Russians by Female Unemployment
In terms of female unemployment, the demographic groups most similar to German Russians are Immigrants from Northern Europe (4.9%, a difference of 0.070%), Osage (4.9%, a difference of 0.080%), Russian (5.0%, a difference of 0.10%), Immigrants from Bolivia (5.0%, a difference of 0.11%), and Immigrants from Ireland (4.9%, a difference of 0.12%).
| Demographics | Rating | Rank | Female Unemployment |
| Celtics | 98.5 /100 | #64 | Exceptional 4.9% |
| Immigrants | North America | 98.3 /100 | #65 | Exceptional 4.9% |
| Hungarians | 98.3 /100 | #66 | Exceptional 4.9% |
| Cubans | 98.3 /100 | #67 | Exceptional 4.9% |
| Tlingit-Haida | 98.3 /100 | #68 | Exceptional 4.9% |
| Immigrants | Ireland | 98.2 /100 | #69 | Exceptional 4.9% |
| Osage | 98.2 /100 | #70 | Exceptional 4.9% |
| German Russians | 98.1 /100 | #71 | Exceptional 4.9% |
| Immigrants | Northern Europe | 98.0 /100 | #72 | Exceptional 4.9% |
| Russians | 98.0 /100 | #73 | Exceptional 5.0% |
| Immigrants | Bolivia | 98.0 /100 | #74 | Exceptional 5.0% |
| Immigrants | Singapore | 98.0 /100 | #75 | Exceptional 5.0% |
| Immigrants | Venezuela | 97.9 /100 | #76 | Exceptional 5.0% |
| Mongolians | 97.8 /100 | #77 | Exceptional 5.0% |
| Immigrants | Netherlands | 97.8 /100 | #78 | Exceptional 5.0% |