Liberian vs Ute 6th Grade
COMPARE
Liberian
Ute
6th Grade
6th Grade Comparison
Liberians
Ute
96.8%
6TH GRADE
7.5/ 100
METRIC RATING
217th/ 347
METRIC RANK
97.1%
6TH GRADE
71.1/ 100
METRIC RATING
155th/ 347
METRIC RANK
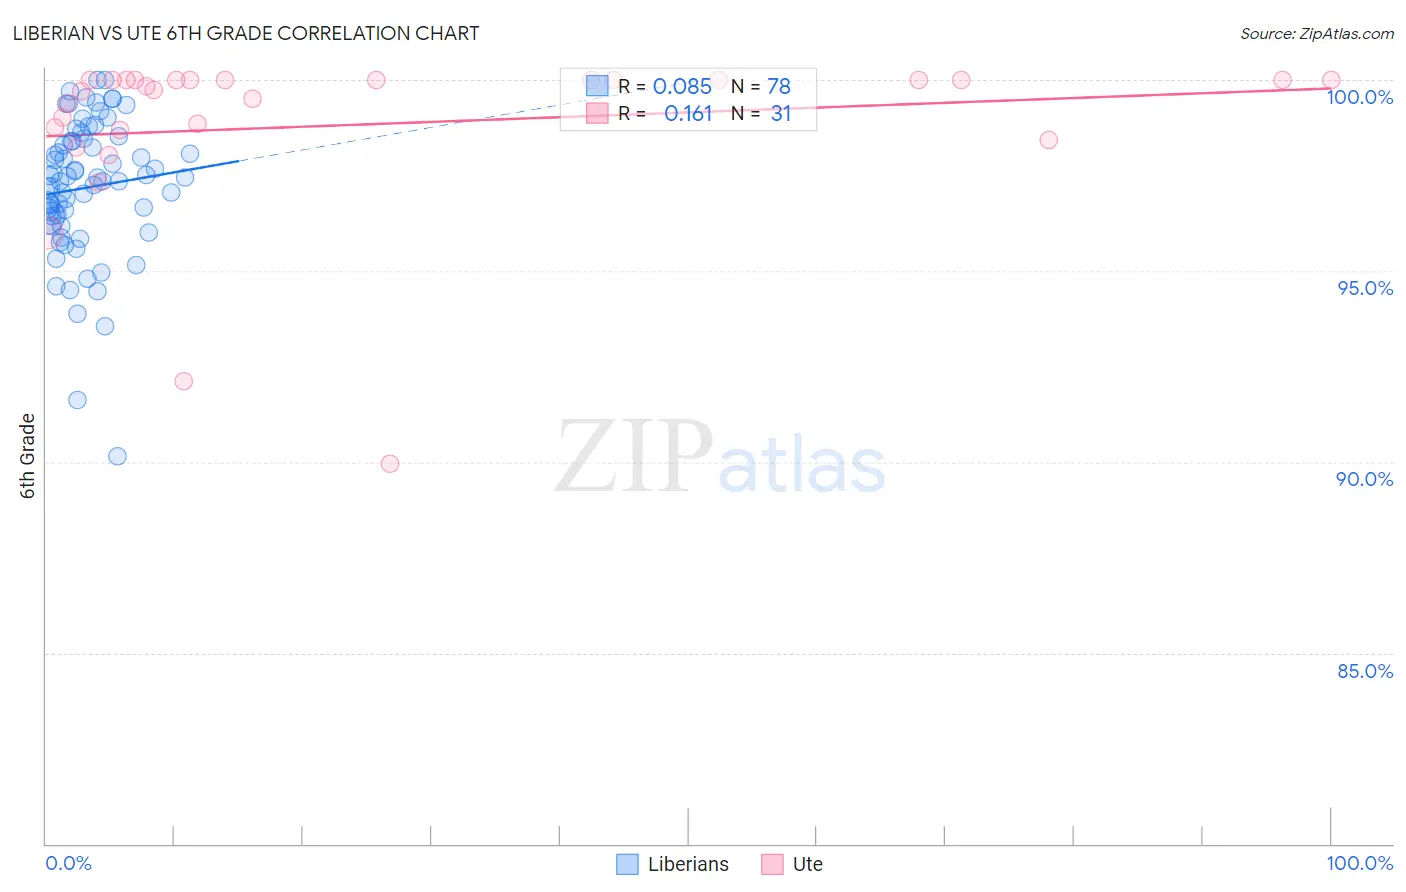
Liberian vs Ute 6th Grade Correlation Chart
The statistical analysis conducted on geographies consisting of 118,098,536 people shows a slight positive correlation between the proportion of Liberians and percentage of population with at least 6th grade education in the United States with a correlation coefficient (R) of 0.085 and weighted average of 96.8%. Similarly, the statistical analysis conducted on geographies consisting of 55,668,539 people shows a poor positive correlation between the proportion of Ute and percentage of population with at least 6th grade education in the United States with a correlation coefficient (R) of 0.161 and weighted average of 97.1%, a difference of 0.39%.
6th Grade Correlation Summary
| Measurement | Liberian | Ute |
| Minimum | 90.1% | 89.9% |
| Maximum | 100.0% | 100.0% |
| Range | 9.9% | 10.1% |
| Mean | 97.2% | 98.8% |
| Median | 97.4% | 99.8% |
| Interquartile 25% (IQ1) | 96.4% | 98.7% |
| Interquartile 75% (IQ3) | 98.4% | 100.0% |
| Interquartile Range (IQR) | 2.0% | 1.3% |
| Standard Deviation (Sample) | 1.8% | 2.3% |
| Standard Deviation (Population) | 1.8% | 2.3% |
Similar Demographics by 6th Grade
Demographics Similar to Liberians by 6th Grade
In terms of 6th grade, the demographic groups most similar to Liberians are Navajo (96.8%, a difference of 0.0%), Portuguese (96.8%, a difference of 0.010%), Sierra Leonean (96.8%, a difference of 0.010%), Paiute (96.8%, a difference of 0.010%), and Costa Rican (96.8%, a difference of 0.010%).
| Demographics | Rating | Rank | 6th Grade |
| Immigrants | Nepal | 10.1 /100 | #210 | Poor 96.8% |
| Immigrants | Iraq | 9.2 /100 | #211 | Tragic 96.8% |
| Moroccans | 9.0 /100 | #212 | Tragic 96.8% |
| Immigrants | Sudan | 8.7 /100 | #213 | Tragic 96.8% |
| Portuguese | 8.2 /100 | #214 | Tragic 96.8% |
| Sierra Leoneans | 8.0 /100 | #215 | Tragic 96.8% |
| Paiute | 7.8 /100 | #216 | Tragic 96.8% |
| Liberians | 7.5 /100 | #217 | Tragic 96.8% |
| Navajo | 7.3 /100 | #218 | Tragic 96.8% |
| Costa Ricans | 6.8 /100 | #219 | Tragic 96.8% |
| Immigrants | Morocco | 6.2 /100 | #220 | Tragic 96.7% |
| Tongans | 6.1 /100 | #221 | Tragic 96.7% |
| Immigrants | Syria | 5.9 /100 | #222 | Tragic 96.7% |
| Bahamians | 4.8 /100 | #223 | Tragic 96.7% |
| Immigrants | Southern Europe | 4.4 /100 | #224 | Tragic 96.7% |
Demographics Similar to Ute by 6th Grade
In terms of 6th grade, the demographic groups most similar to Ute are Soviet Union (97.2%, a difference of 0.0%), Immigrants from Jordan (97.2%, a difference of 0.010%), Immigrants from Eastern Europe (97.2%, a difference of 0.010%), Alsatian (97.1%, a difference of 0.010%), and Immigrants from Bosnia and Herzegovina (97.2%, a difference of 0.020%).
| Demographics | Rating | Rank | 6th Grade |
| Immigrants | Greece | 77.8 /100 | #148 | Good 97.2% |
| Immigrants | Israel | 76.0 /100 | #149 | Good 97.2% |
| Immigrants | Bosnia and Herzegovina | 74.8 /100 | #150 | Good 97.2% |
| French American Indians | 74.0 /100 | #151 | Good 97.2% |
| Immigrants | Jordan | 73.0 /100 | #152 | Good 97.2% |
| Immigrants | Eastern Europe | 72.6 /100 | #153 | Good 97.2% |
| Soviet Union | 71.5 /100 | #154 | Good 97.2% |
| Ute | 71.1 /100 | #155 | Good 97.1% |
| Alsatians | 69.8 /100 | #156 | Good 97.1% |
| Immigrants | Russia | 67.6 /100 | #157 | Good 97.1% |
| Immigrants | Iran | 63.3 /100 | #158 | Good 97.1% |
| Kenyans | 62.9 /100 | #159 | Good 97.1% |
| Ugandans | 62.2 /100 | #160 | Good 97.1% |
| Immigrants | Belarus | 60.4 /100 | #161 | Good 97.1% |
| Marshallese | 60.2 /100 | #162 | Good 97.1% |