Uruguayan vs Swiss Unemployment Among Women with Children Under 6 years
COMPARE
Uruguayan
Swiss
Unemployment Among Women with Children Under 6 years
Unemployment Among Women with Children Under 6 years Comparison
Uruguayans
Swiss
7.5%
UNEMPLOYMENT AMONG WOMEN WITH CHILDREN UNDER 6 YEARS
74.7/ 100
METRIC RATING
153rd/ 347
METRIC RANK
7.9%
UNEMPLOYMENT AMONG WOMEN WITH CHILDREN UNDER 6 YEARS
12.3/ 100
METRIC RATING
212th/ 347
METRIC RANK
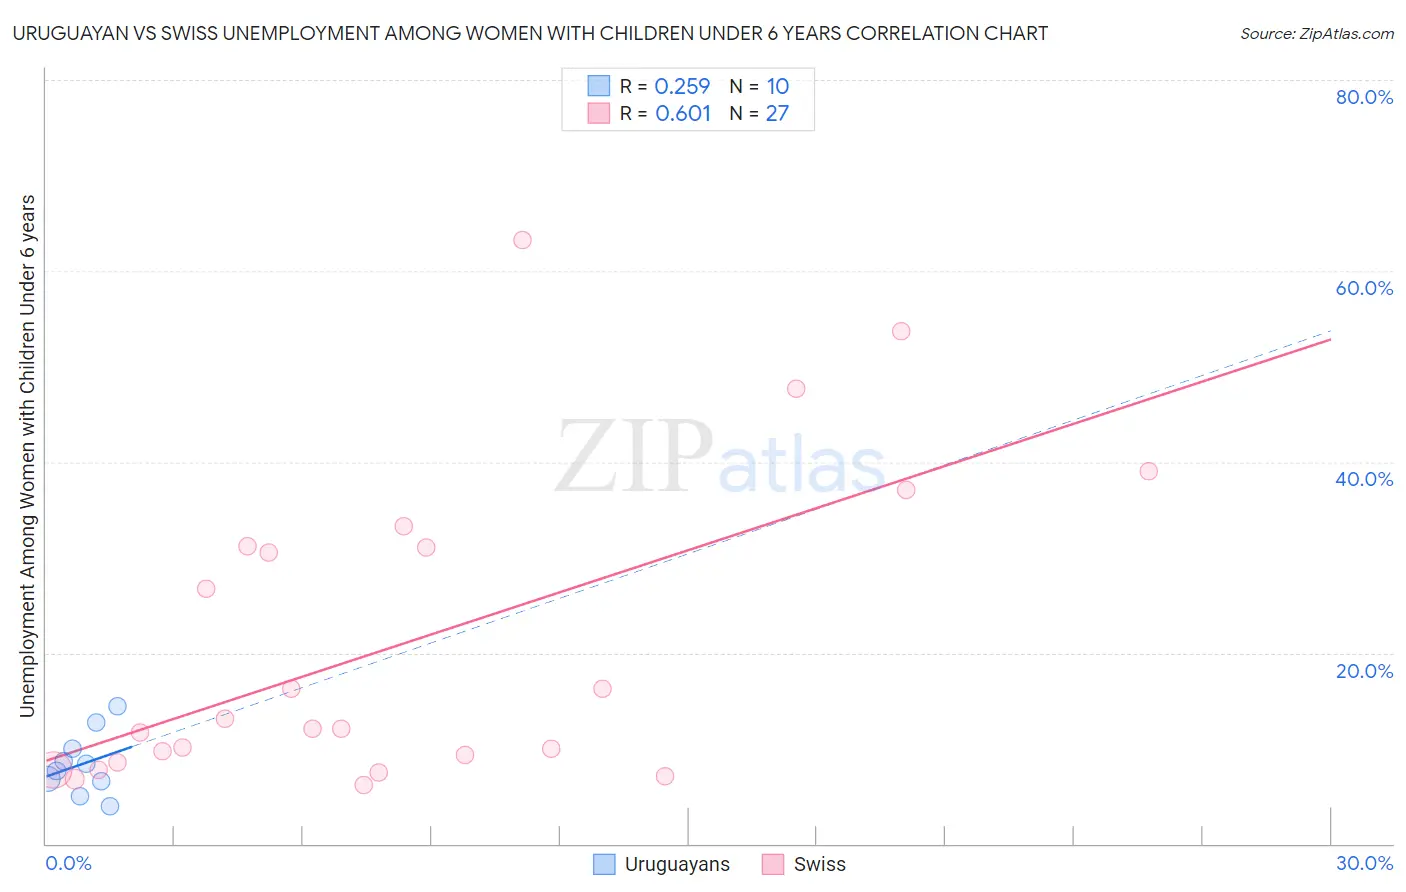
Uruguayan vs Swiss Unemployment Among Women with Children Under 6 years Correlation Chart
The statistical analysis conducted on geographies consisting of 126,864,314 people shows a weak positive correlation between the proportion of Uruguayans and unemployment rate among women with children under the age of 6 in the United States with a correlation coefficient (R) of 0.259 and weighted average of 7.5%. Similarly, the statistical analysis conducted on geographies consisting of 326,858,095 people shows a significant positive correlation between the proportion of Swiss and unemployment rate among women with children under the age of 6 in the United States with a correlation coefficient (R) of 0.601 and weighted average of 7.9%, a difference of 5.1%.
Unemployment Among Women with Children Under 6 years Correlation Summary
| Measurement | Uruguayan | Swiss |
| Minimum | 4.0% | 6.2% |
| Maximum | 14.4% | 63.2% |
| Range | 10.4% | 57.1% |
| Mean | 8.4% | 20.9% |
| Median | 8.0% | 12.0% |
| Interquartile 25% (IQ1) | 6.5% | 8.5% |
| Interquartile 75% (IQ3) | 10.0% | 31.1% |
| Interquartile Range (IQR) | 3.5% | 22.6% |
| Standard Deviation (Sample) | 3.2% | 16.2% |
| Standard Deviation (Population) | 3.1% | 15.9% |
Similar Demographics by Unemployment Among Women with Children Under 6 years
Demographics Similar to Uruguayans by Unemployment Among Women with Children Under 6 years
In terms of unemployment among women with children under 6 years, the demographic groups most similar to Uruguayans are Bangladeshi (7.5%, a difference of 0.010%), Immigrants from Peru (7.5%, a difference of 0.020%), Northern European (7.5%, a difference of 0.030%), South American (7.5%, a difference of 0.050%), and Colombian (7.5%, a difference of 0.12%).
| Demographics | Rating | Rank | Unemployment Among Women with Children Under 6 years |
| Japanese | 78.9 /100 | #146 | Good 7.5% |
| Immigrants | Oceania | 78.4 /100 | #147 | Good 7.5% |
| Immigrants | Brazil | 77.3 /100 | #148 | Good 7.5% |
| Colombians | 76.1 /100 | #149 | Good 7.5% |
| Aleuts | 76.0 /100 | #150 | Good 7.5% |
| Immigrants | Peru | 74.9 /100 | #151 | Good 7.5% |
| Bangladeshis | 74.8 /100 | #152 | Good 7.5% |
| Uruguayans | 74.7 /100 | #153 | Good 7.5% |
| Northern Europeans | 74.3 /100 | #154 | Good 7.5% |
| South Americans | 74.1 /100 | #155 | Good 7.5% |
| Immigrants | Southern Europe | 73.2 /100 | #156 | Good 7.5% |
| Peruvians | 72.3 /100 | #157 | Good 7.5% |
| Croatians | 71.9 /100 | #158 | Good 7.5% |
| Immigrants | Philippines | 71.3 /100 | #159 | Good 7.5% |
| Bolivians | 70.8 /100 | #160 | Good 7.5% |
Demographics Similar to Swiss by Unemployment Among Women with Children Under 6 years
In terms of unemployment among women with children under 6 years, the demographic groups most similar to Swiss are Scottish (7.9%, a difference of 0.13%), Spanish (7.9%, a difference of 0.16%), Ecuadorian (7.9%, a difference of 0.17%), Immigrants from Lebanon (7.9%, a difference of 0.19%), and Immigrants from Nigeria (7.9%, a difference of 0.31%).
| Demographics | Rating | Rank | Unemployment Among Women with Children Under 6 years |
| Immigrants | Immigrants | 21.4 /100 | #205 | Fair 7.8% |
| Hungarians | 21.2 /100 | #206 | Fair 7.8% |
| Canadians | 20.6 /100 | #207 | Fair 7.8% |
| Immigrants | Syria | 18.9 /100 | #208 | Poor 7.8% |
| Costa Ricans | 17.6 /100 | #209 | Poor 7.8% |
| Poles | 16.0 /100 | #210 | Poor 7.9% |
| Immigrants | Ecuador | 14.9 /100 | #211 | Poor 7.9% |
| Swiss | 12.3 /100 | #212 | Poor 7.9% |
| Scottish | 11.4 /100 | #213 | Poor 7.9% |
| Spanish | 11.3 /100 | #214 | Poor 7.9% |
| Ecuadorians | 11.2 /100 | #215 | Poor 7.9% |
| Immigrants | Lebanon | 11.1 /100 | #216 | Poor 7.9% |
| Immigrants | Nigeria | 10.3 /100 | #217 | Poor 7.9% |
| Moroccans | 9.7 /100 | #218 | Tragic 7.9% |
| Arabs | 9.4 /100 | #219 | Tragic 7.9% |