Immigrants from Western Africa vs Immigrants from Bangladesh Unemployment Among Women with Children Under 6 years
COMPARE
Immigrants from Western Africa
Immigrants from Bangladesh
Unemployment Among Women with Children Under 6 years
Unemployment Among Women with Children Under 6 years Comparison
Immigrants from Western Africa
Immigrants from Bangladesh
8.2%
UNEMPLOYMENT AMONG WOMEN WITH CHILDREN UNDER 6 YEARS
1.1/ 100
METRIC RATING
248th/ 347
METRIC RANK
8.8%
UNEMPLOYMENT AMONG WOMEN WITH CHILDREN UNDER 6 YEARS
0.0/ 100
METRIC RATING
293rd/ 347
METRIC RANK
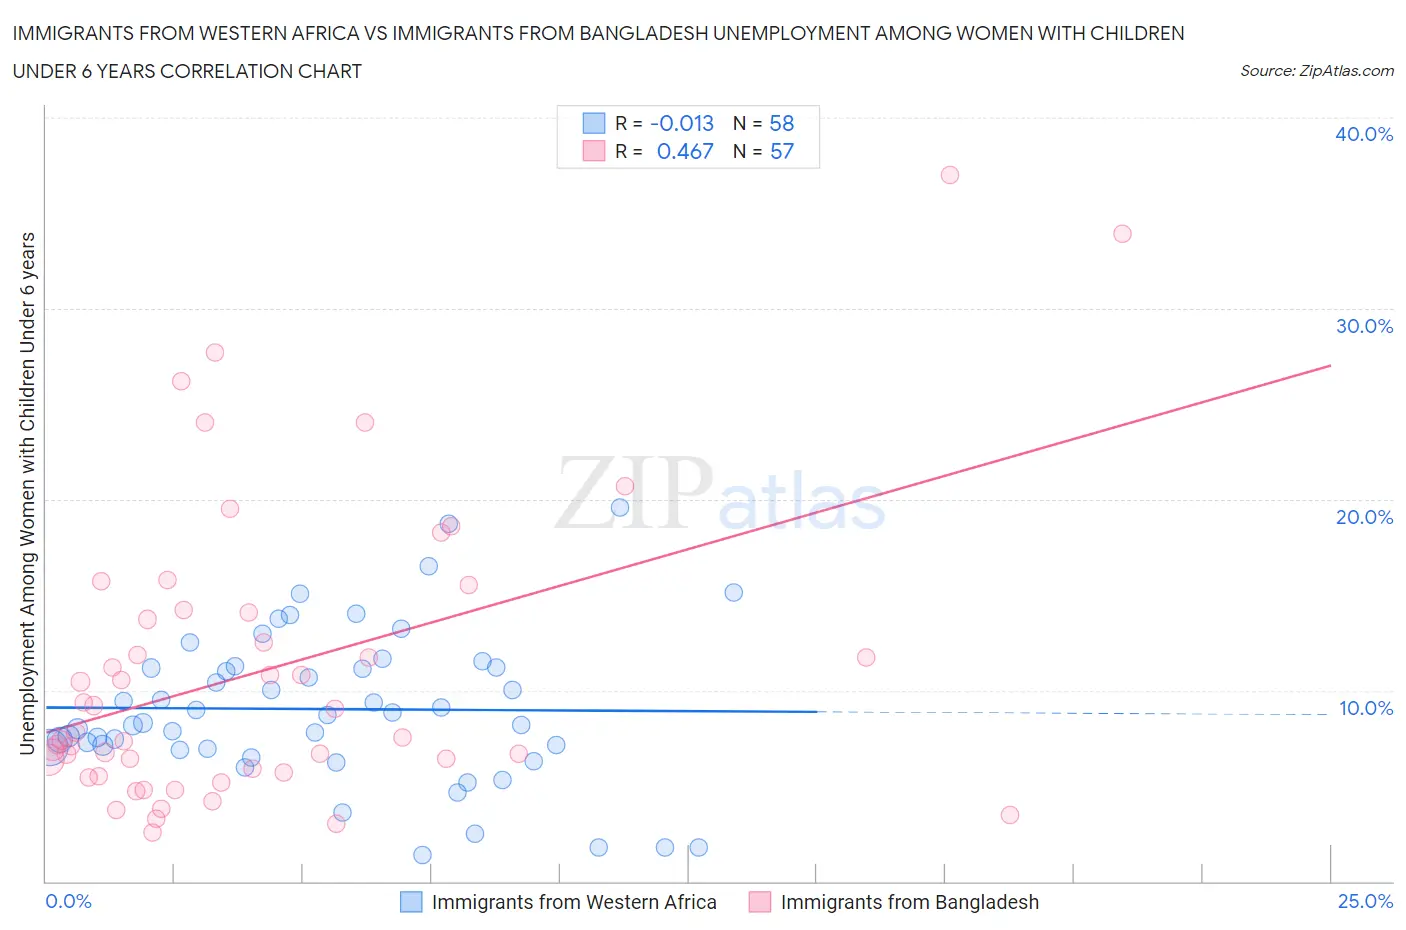
Immigrants from Western Africa vs Immigrants from Bangladesh Unemployment Among Women with Children Under 6 years Correlation Chart
The statistical analysis conducted on geographies consisting of 284,723,749 people shows no correlation between the proportion of Immigrants from Western Africa and unemployment rate among women with children under the age of 6 in the United States with a correlation coefficient (R) of -0.013 and weighted average of 8.2%. Similarly, the statistical analysis conducted on geographies consisting of 173,597,971 people shows a moderate positive correlation between the proportion of Immigrants from Bangladesh and unemployment rate among women with children under the age of 6 in the United States with a correlation coefficient (R) of 0.467 and weighted average of 8.8%, a difference of 7.6%.
Unemployment Among Women with Children Under 6 years Correlation Summary
| Measurement | Immigrants from Western Africa | Immigrants from Bangladesh |
| Minimum | 1.4% | 2.5% |
| Maximum | 19.6% | 37.0% |
| Range | 18.2% | 34.5% |
| Mean | 9.0% | 11.1% |
| Median | 8.5% | 7.8% |
| Interquartile 25% (IQ1) | 7.0% | 5.8% |
| Interquartile 75% (IQ3) | 11.2% | 14.2% |
| Interquartile Range (IQR) | 4.2% | 8.4% |
| Standard Deviation (Sample) | 4.0% | 7.7% |
| Standard Deviation (Population) | 3.9% | 7.6% |
Similar Demographics by Unemployment Among Women with Children Under 6 years
Demographics Similar to Immigrants from Western Africa by Unemployment Among Women with Children Under 6 years
In terms of unemployment among women with children under 6 years, the demographic groups most similar to Immigrants from Western Africa are German Russian (8.2%, a difference of 0.040%), Immigrants from Sierra Leone (8.2%, a difference of 0.090%), Nigerian (8.2%, a difference of 0.10%), Guyanese (8.2%, a difference of 0.27%), and Ghanaian (8.2%, a difference of 0.27%).
| Demographics | Rating | Rank | Unemployment Among Women with Children Under 6 years |
| Liberians | 2.6 /100 | #241 | Tragic 8.1% |
| Dutch | 2.5 /100 | #242 | Tragic 8.1% |
| Hawaiians | 1.8 /100 | #243 | Tragic 8.2% |
| French | 1.7 /100 | #244 | Tragic 8.2% |
| Native Hawaiians | 1.7 /100 | #245 | Tragic 8.2% |
| Central Americans | 1.4 /100 | #246 | Tragic 8.2% |
| German Russians | 1.2 /100 | #247 | Tragic 8.2% |
| Immigrants | Western Africa | 1.1 /100 | #248 | Tragic 8.2% |
| Immigrants | Sierra Leone | 1.1 /100 | #249 | Tragic 8.2% |
| Nigerians | 1.1 /100 | #250 | Tragic 8.2% |
| Guyanese | 1.0 /100 | #251 | Tragic 8.2% |
| Ghanaians | 1.0 /100 | #252 | Tragic 8.2% |
| Immigrants | Guyana | 0.8 /100 | #253 | Tragic 8.2% |
| Immigrants | Caribbean | 0.7 /100 | #254 | Tragic 8.3% |
| Immigrants | Portugal | 0.6 /100 | #255 | Tragic 8.3% |
Demographics Similar to Immigrants from Bangladesh by Unemployment Among Women with Children Under 6 years
In terms of unemployment among women with children under 6 years, the demographic groups most similar to Immigrants from Bangladesh are Nonimmigrants (8.8%, a difference of 0.19%), Cheyenne (8.8%, a difference of 0.23%), Immigrants from Central America (8.9%, a difference of 0.23%), Immigrants from Dominican Republic (8.9%, a difference of 0.36%), and Mexican (8.9%, a difference of 0.46%).
| Demographics | Rating | Rank | Unemployment Among Women with Children Under 6 years |
| Seminole | 0.0 /100 | #286 | Tragic 8.7% |
| Menominee | 0.0 /100 | #287 | Tragic 8.7% |
| Bahamians | 0.0 /100 | #288 | Tragic 8.7% |
| Iroquois | 0.0 /100 | #289 | Tragic 8.7% |
| Vietnamese | 0.0 /100 | #290 | Tragic 8.8% |
| Jamaicans | 0.0 /100 | #291 | Tragic 8.8% |
| Cheyenne | 0.0 /100 | #292 | Tragic 8.8% |
| Immigrants | Bangladesh | 0.0 /100 | #293 | Tragic 8.8% |
| Immigrants | Nonimmigrants | 0.0 /100 | #294 | Tragic 8.8% |
| Immigrants | Central America | 0.0 /100 | #295 | Tragic 8.9% |
| Immigrants | Dominican Republic | 0.0 /100 | #296 | Tragic 8.9% |
| Mexicans | 0.0 /100 | #297 | Tragic 8.9% |
| Tlingit-Haida | 0.0 /100 | #298 | Tragic 8.9% |
| Immigrants | Jamaica | 0.0 /100 | #299 | Tragic 8.9% |
| Creek | 0.0 /100 | #300 | Tragic 8.9% |