Kenyan vs Immigrants from Pakistan Male Unemployment
COMPARE
Kenyan
Immigrants from Pakistan
Male Unemployment
Male Unemployment Comparison
Kenyans
Immigrants from Pakistan
5.2%
MALE UNEMPLOYMENT
79.4/ 100
METRIC RATING
139th/ 347
METRIC RANK
5.1%
MALE UNEMPLOYMENT
90.9/ 100
METRIC RATING
109th/ 347
METRIC RANK
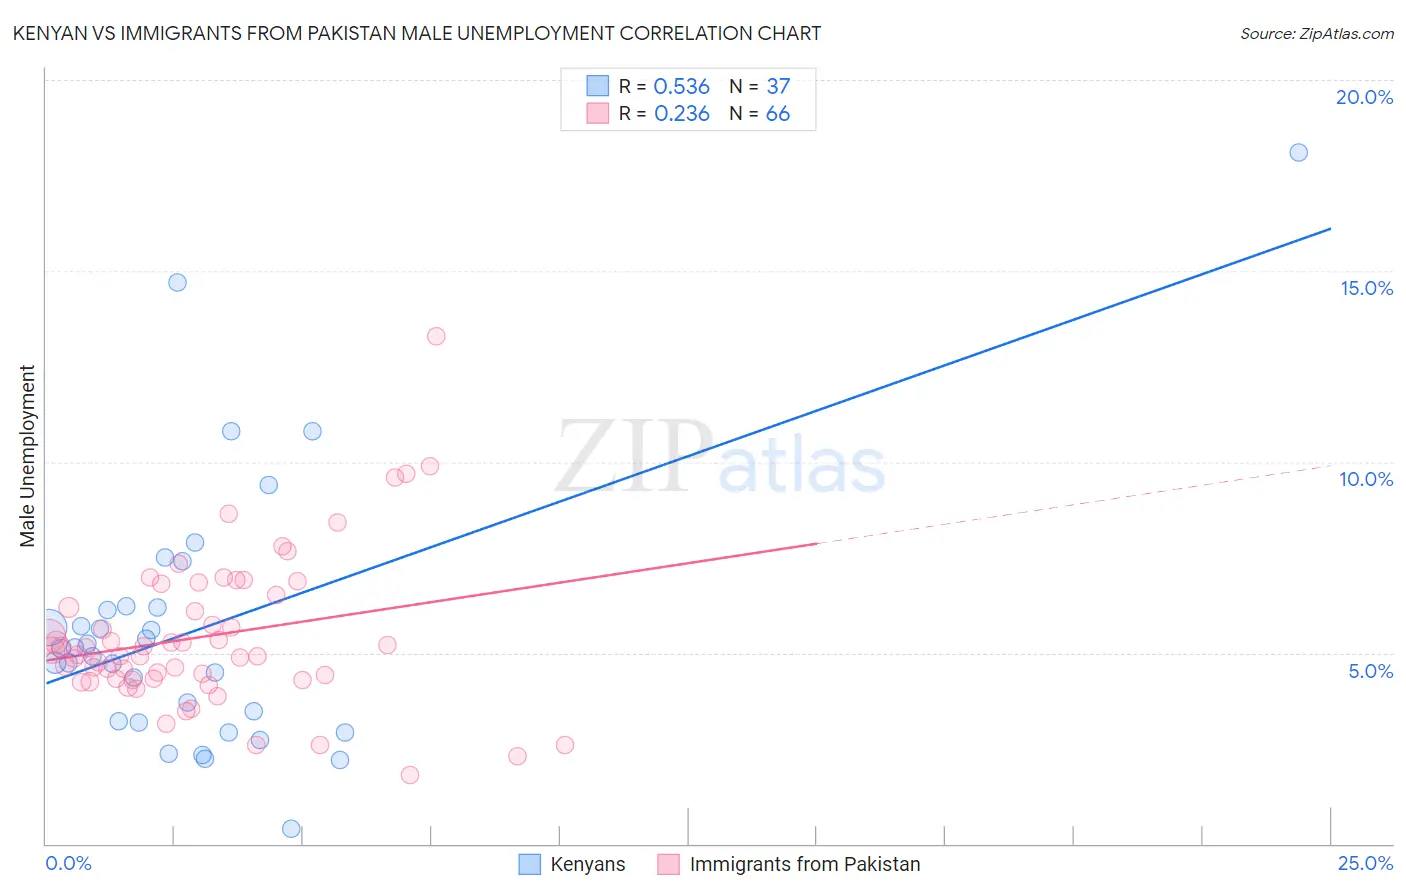
Kenyan vs Immigrants from Pakistan Male Unemployment Correlation Chart
The statistical analysis conducted on geographies consisting of 168,001,564 people shows a substantial positive correlation between the proportion of Kenyans and unemployment rate among males in the United States with a correlation coefficient (R) of 0.536 and weighted average of 5.2%. Similarly, the statistical analysis conducted on geographies consisting of 283,399,796 people shows a weak positive correlation between the proportion of Immigrants from Pakistan and unemployment rate among males in the United States with a correlation coefficient (R) of 0.236 and weighted average of 5.1%, a difference of 1.4%.
Male Unemployment Correlation Summary
| Measurement | Kenyan | Immigrants from Pakistan |
| Minimum | 0.40% | 1.8% |
| Maximum | 18.1% | 13.3% |
| Range | 17.7% | 11.5% |
| Mean | 5.6% | 5.4% |
| Median | 5.1% | 5.0% |
| Interquartile 25% (IQ1) | 3.2% | 4.3% |
| Interquartile 75% (IQ3) | 6.2% | 6.5% |
| Interquartile Range (IQR) | 3.0% | 2.2% |
| Standard Deviation (Sample) | 3.5% | 2.0% |
| Standard Deviation (Population) | 3.5% | 2.0% |
Similar Demographics by Male Unemployment
Demographics Similar to Kenyans by Male Unemployment
In terms of male unemployment, the demographic groups most similar to Kenyans are Brazilian (5.2%, a difference of 0.010%), Immigrants from Croatia (5.2%, a difference of 0.020%), Immigrants from Switzerland (5.2%, a difference of 0.020%), Immigrants from Eastern Africa (5.2%, a difference of 0.030%), and Lebanese (5.2%, a difference of 0.040%).
| Demographics | Rating | Rank | Male Unemployment |
| Chickasaw | 82.9 /100 | #132 | Excellent 5.2% |
| Colombians | 81.1 /100 | #133 | Excellent 5.2% |
| Pakistanis | 80.5 /100 | #134 | Excellent 5.2% |
| Immigrants | Saudi Arabia | 80.1 /100 | #135 | Excellent 5.2% |
| Lebanese | 79.9 /100 | #136 | Good 5.2% |
| Immigrants | Eastern Africa | 79.8 /100 | #137 | Good 5.2% |
| Immigrants | Croatia | 79.7 /100 | #138 | Good 5.2% |
| Kenyans | 79.4 /100 | #139 | Good 5.2% |
| Brazilians | 79.3 /100 | #140 | Good 5.2% |
| Immigrants | Switzerland | 79.2 /100 | #141 | Good 5.2% |
| Fijians | 78.3 /100 | #142 | Good 5.2% |
| Syrians | 78.0 /100 | #143 | Good 5.2% |
| Sri Lankans | 77.9 /100 | #144 | Good 5.2% |
| Macedonians | 77.7 /100 | #145 | Good 5.2% |
| Immigrants | Kenya | 77.6 /100 | #146 | Good 5.2% |
Demographics Similar to Immigrants from Pakistan by Male Unemployment
In terms of male unemployment, the demographic groups most similar to Immigrants from Pakistan are Immigrants from England (5.1%, a difference of 0.020%), Immigrants from Eastern Asia (5.1%, a difference of 0.030%), Immigrants from Nicaragua (5.1%, a difference of 0.060%), Ethiopian (5.1%, a difference of 0.070%), and Immigrants from Ethiopia (5.1%, a difference of 0.11%).
| Demographics | Rating | Rank | Male Unemployment |
| Immigrants | France | 92.7 /100 | #102 | Exceptional 5.1% |
| Immigrants | Jordan | 91.9 /100 | #103 | Exceptional 5.1% |
| Immigrants | Chile | 91.8 /100 | #104 | Exceptional 5.1% |
| Immigrants | Czechoslovakia | 91.7 /100 | #105 | Exceptional 5.1% |
| Immigrants | Ethiopia | 91.5 /100 | #106 | Exceptional 5.1% |
| Ethiopians | 91.3 /100 | #107 | Exceptional 5.1% |
| Immigrants | Nicaragua | 91.2 /100 | #108 | Exceptional 5.1% |
| Immigrants | Pakistan | 90.9 /100 | #109 | Exceptional 5.1% |
| Immigrants | England | 90.8 /100 | #110 | Exceptional 5.1% |
| Immigrants | Eastern Asia | 90.8 /100 | #111 | Exceptional 5.1% |
| Immigrants | Moldova | 90.3 /100 | #112 | Exceptional 5.1% |
| Immigrants | Austria | 90.3 /100 | #113 | Exceptional 5.1% |
| Romanians | 89.8 /100 | #114 | Excellent 5.1% |
| Immigrants | Asia | 89.6 /100 | #115 | Excellent 5.1% |
| Immigrants | Denmark | 89.4 /100 | #116 | Excellent 5.1% |