Kenyan vs Iranian Male Unemployment
COMPARE
Kenyan
Iranian
Male Unemployment
Male Unemployment Comparison
Kenyans
Iranians
5.2%
MALE UNEMPLOYMENT
79.4/ 100
METRIC RATING
139th/ 347
METRIC RANK
5.0%
MALE UNEMPLOYMENT
96.4/ 100
METRIC RATING
77th/ 347
METRIC RANK
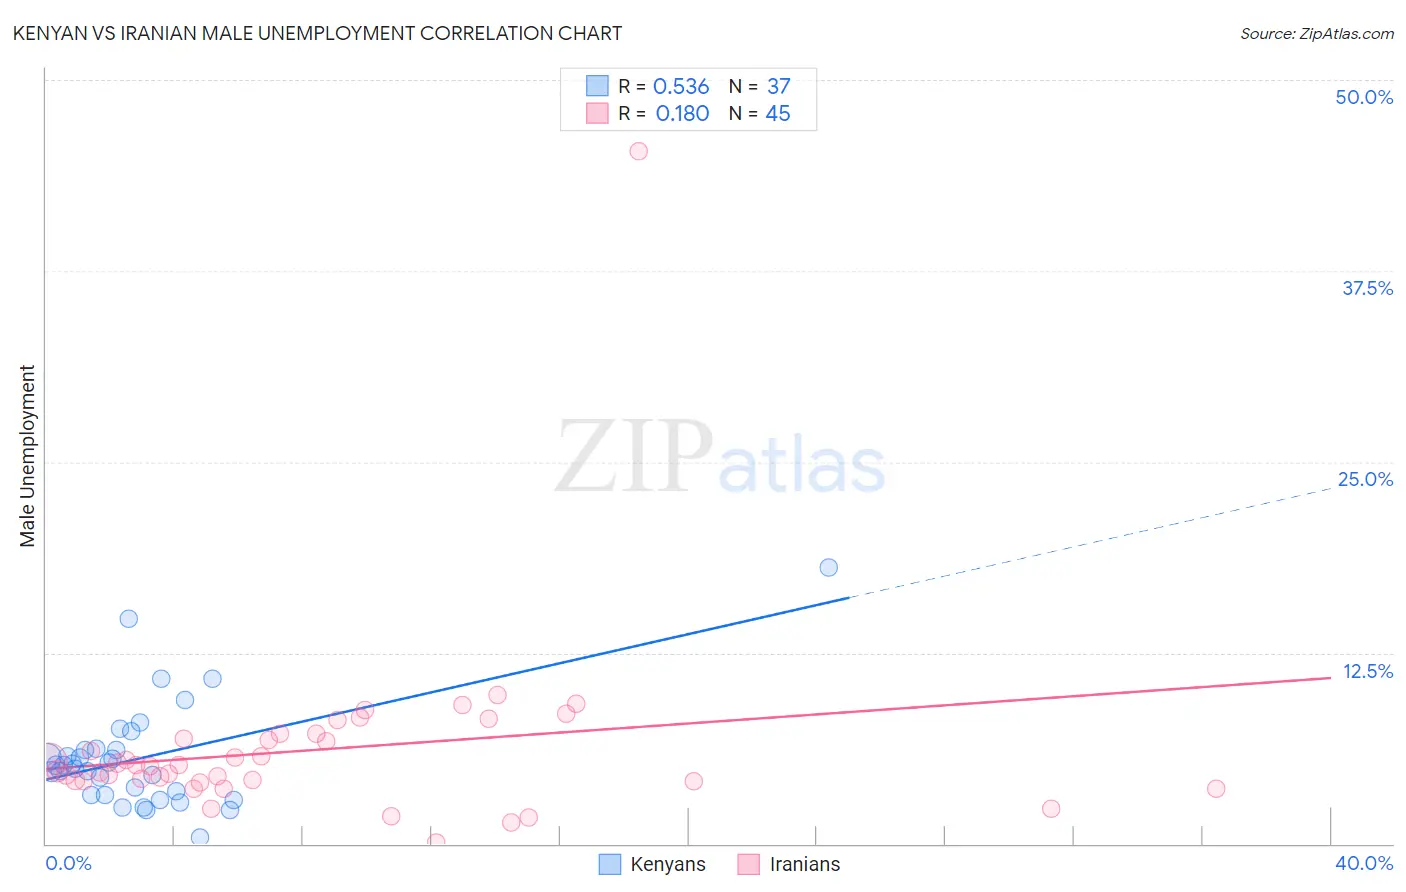
Kenyan vs Iranian Male Unemployment Correlation Chart
The statistical analysis conducted on geographies consisting of 168,001,564 people shows a substantial positive correlation between the proportion of Kenyans and unemployment rate among males in the United States with a correlation coefficient (R) of 0.536 and weighted average of 5.2%. Similarly, the statistical analysis conducted on geographies consisting of 316,157,253 people shows a poor positive correlation between the proportion of Iranians and unemployment rate among males in the United States with a correlation coefficient (R) of 0.180 and weighted average of 5.0%, a difference of 3.0%.
Male Unemployment Correlation Summary
| Measurement | Kenyan | Iranian |
| Minimum | 0.40% | 0.10% |
| Maximum | 18.1% | 45.3% |
| Range | 17.7% | 45.2% |
| Mean | 5.6% | 6.1% |
| Median | 5.1% | 5.1% |
| Interquartile 25% (IQ1) | 3.2% | 4.1% |
| Interquartile 75% (IQ3) | 6.2% | 7.0% |
| Interquartile Range (IQR) | 3.0% | 2.9% |
| Standard Deviation (Sample) | 3.5% | 6.4% |
| Standard Deviation (Population) | 3.5% | 6.3% |
Similar Demographics by Male Unemployment
Demographics Similar to Kenyans by Male Unemployment
In terms of male unemployment, the demographic groups most similar to Kenyans are Brazilian (5.2%, a difference of 0.010%), Immigrants from Croatia (5.2%, a difference of 0.020%), Immigrants from Switzerland (5.2%, a difference of 0.020%), Immigrants from Eastern Africa (5.2%, a difference of 0.030%), and Lebanese (5.2%, a difference of 0.040%).
| Demographics | Rating | Rank | Male Unemployment |
| Chickasaw | 82.9 /100 | #132 | Excellent 5.2% |
| Colombians | 81.1 /100 | #133 | Excellent 5.2% |
| Pakistanis | 80.5 /100 | #134 | Excellent 5.2% |
| Immigrants | Saudi Arabia | 80.1 /100 | #135 | Excellent 5.2% |
| Lebanese | 79.9 /100 | #136 | Good 5.2% |
| Immigrants | Eastern Africa | 79.8 /100 | #137 | Good 5.2% |
| Immigrants | Croatia | 79.7 /100 | #138 | Good 5.2% |
| Kenyans | 79.4 /100 | #139 | Good 5.2% |
| Brazilians | 79.3 /100 | #140 | Good 5.2% |
| Immigrants | Switzerland | 79.2 /100 | #141 | Good 5.2% |
| Fijians | 78.3 /100 | #142 | Good 5.2% |
| Syrians | 78.0 /100 | #143 | Good 5.2% |
| Sri Lankans | 77.9 /100 | #144 | Good 5.2% |
| Macedonians | 77.7 /100 | #145 | Good 5.2% |
| Immigrants | Kenya | 77.6 /100 | #146 | Good 5.2% |
Demographics Similar to Iranians by Male Unemployment
In terms of male unemployment, the demographic groups most similar to Iranians are Immigrants from Northern Europe (5.0%, a difference of 0.010%), South African (5.0%, a difference of 0.020%), Immigrants from Sudan (5.0%, a difference of 0.050%), Argentinean (5.0%, a difference of 0.080%), and French (5.0%, a difference of 0.080%).
| Demographics | Rating | Rank | Male Unemployment |
| Whites/Caucasians | 97.3 /100 | #70 | Exceptional 5.0% |
| New Zealanders | 97.3 /100 | #71 | Exceptional 5.0% |
| Immigrants | South Africa | 97.1 /100 | #72 | Exceptional 5.0% |
| Greeks | 97.0 /100 | #73 | Exceptional 5.0% |
| Immigrants | North America | 96.9 /100 | #74 | Exceptional 5.0% |
| Assyrians/Chaldeans/Syriacs | 96.9 /100 | #75 | Exceptional 5.0% |
| Immigrants | Sudan | 96.5 /100 | #76 | Exceptional 5.0% |
| Iranians | 96.4 /100 | #77 | Exceptional 5.0% |
| Immigrants | Northern Europe | 96.4 /100 | #78 | Exceptional 5.0% |
| South Africans | 96.4 /100 | #79 | Exceptional 5.0% |
| Argentineans | 96.2 /100 | #80 | Exceptional 5.0% |
| French | 96.2 /100 | #81 | Exceptional 5.0% |
| Chileans | 96.2 /100 | #82 | Exceptional 5.0% |
| Immigrants | Eritrea | 96.0 /100 | #83 | Exceptional 5.0% |
| Serbians | 95.7 /100 | #84 | Exceptional 5.1% |