Yup'ik vs Immigrants from Denmark Female Unemployment
COMPARE
Yup'ik
Immigrants from Denmark
Female Unemployment
Female Unemployment Comparison
Yup'ik
Immigrants from Denmark
10.9%
FEMALE UNEMPLOYMENT
0.0/ 100
METRIC RATING
346th/ 347
METRIC RANK
5.2%
FEMALE UNEMPLOYMENT
55.0/ 100
METRIC RATING
171st/ 347
METRIC RANK
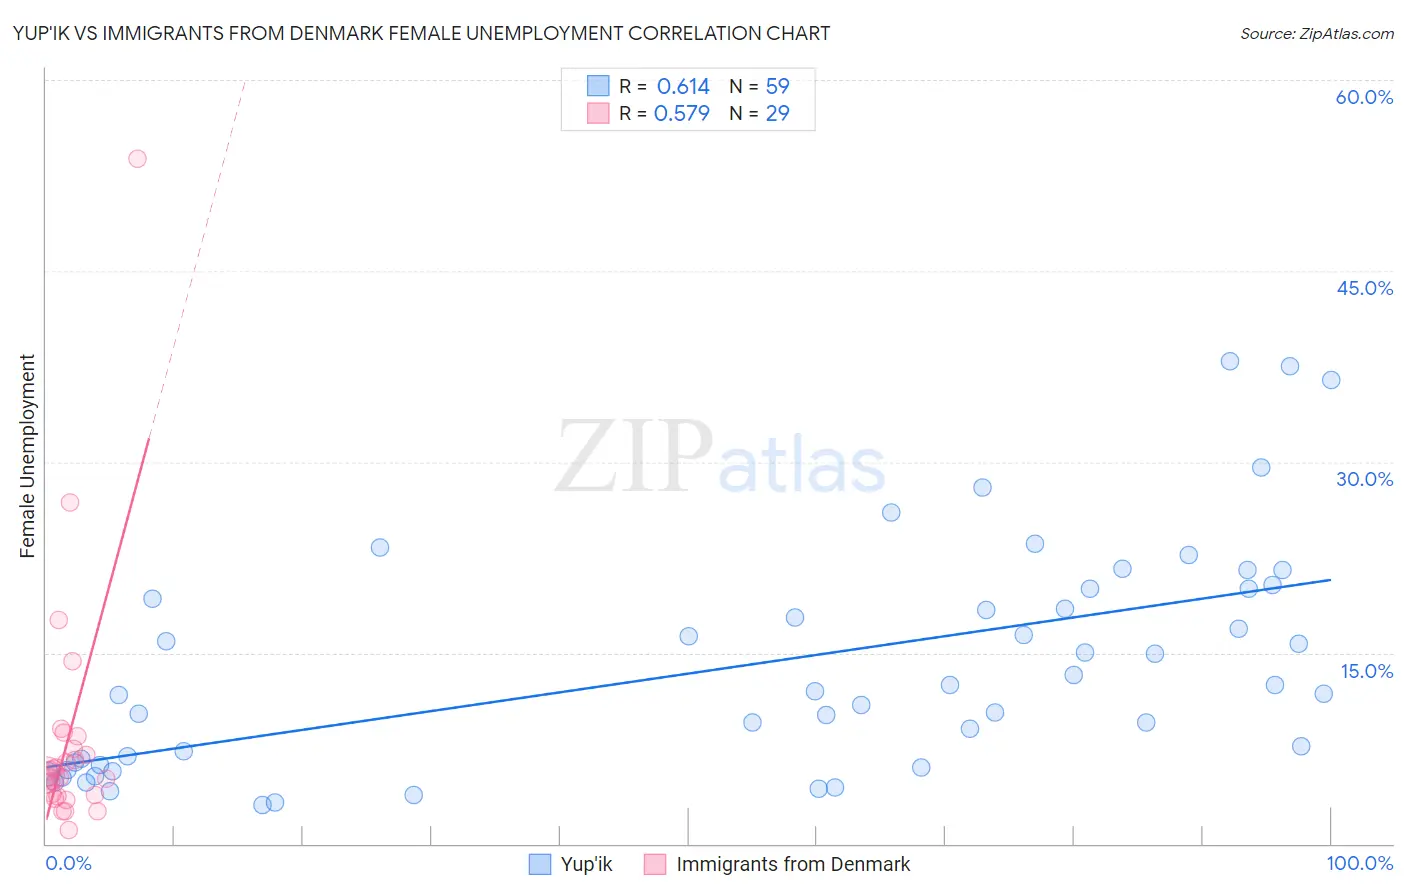
Yup'ik vs Immigrants from Denmark Female Unemployment Correlation Chart
The statistical analysis conducted on geographies consisting of 39,915,126 people shows a significant positive correlation between the proportion of Yup'ik and unemploymnet rate among females in the United States with a correlation coefficient (R) of 0.614 and weighted average of 10.9%. Similarly, the statistical analysis conducted on geographies consisting of 136,180,001 people shows a substantial positive correlation between the proportion of Immigrants from Denmark and unemploymnet rate among females in the United States with a correlation coefficient (R) of 0.579 and weighted average of 5.2%, a difference of 107.4%.
Female Unemployment Correlation Summary
| Measurement | Yup'ik | Immigrants from Denmark |
| Minimum | 3.0% | 1.1% |
| Maximum | 37.9% | 53.8% |
| Range | 34.9% | 52.7% |
| Mean | 14.0% | 8.3% |
| Median | 12.0% | 5.4% |
| Interquartile 25% (IQ1) | 6.2% | 3.8% |
| Interquartile 75% (IQ3) | 20.0% | 8.0% |
| Interquartile Range (IQR) | 13.8% | 4.2% |
| Standard Deviation (Sample) | 8.8% | 10.1% |
| Standard Deviation (Population) | 8.8% | 10.0% |
Similar Demographics by Female Unemployment
Demographics Similar to Yup'ik by Female Unemployment
In terms of female unemployment, the demographic groups most similar to Yup'ik are Crow (12.1%, a difference of 11.5%), Yuman (9.6%, a difference of 13.4%), Pima (9.3%, a difference of 16.5%), Arapaho (8.8%, a difference of 23.7%), and Puerto Rican (8.3%, a difference of 30.4%).
| Demographics | Rating | Rank | Female Unemployment |
| Menominee | 0.0 /100 | #333 | Tragic 7.0% |
| Immigrants | Armenia | 0.0 /100 | #334 | Tragic 7.1% |
| Dominicans | 0.0 /100 | #335 | Tragic 7.2% |
| Immigrants | Dominican Republic | 0.0 /100 | #336 | Tragic 7.2% |
| Navajo | 0.0 /100 | #337 | Tragic 7.3% |
| Tohono O'odham | 0.0 /100 | #338 | Tragic 7.7% |
| Immigrants | Yemen | 0.0 /100 | #339 | Tragic 7.8% |
| Hopi | 0.0 /100 | #340 | Tragic 8.1% |
| Inupiat | 0.0 /100 | #341 | Tragic 8.2% |
| Puerto Ricans | 0.0 /100 | #342 | Tragic 8.3% |
| Arapaho | 0.0 /100 | #343 | Tragic 8.8% |
| Pima | 0.0 /100 | #344 | Tragic 9.3% |
| Yuman | 0.0 /100 | #345 | Tragic 9.6% |
| Yup'ik | 0.0 /100 | #346 | Tragic 10.9% |
| Crow | 0.0 /100 | #347 | Tragic 12.1% |
Demographics Similar to Immigrants from Denmark by Female Unemployment
In terms of female unemployment, the demographic groups most similar to Immigrants from Denmark are Spanish (5.2%, a difference of 0.050%), Immigrants from Chile (5.2%, a difference of 0.24%), Immigrants from Uganda (5.3%, a difference of 0.26%), Sri Lankan (5.2%, a difference of 0.27%), and Iranian (5.3%, a difference of 0.28%).
| Demographics | Rating | Rank | Female Unemployment |
| Bangladeshis | 64.3 /100 | #164 | Good 5.2% |
| Syrians | 62.8 /100 | #165 | Good 5.2% |
| Native Hawaiians | 62.7 /100 | #166 | Good 5.2% |
| Immigrants | Thailand | 62.1 /100 | #167 | Good 5.2% |
| Sri Lankans | 59.4 /100 | #168 | Average 5.2% |
| Immigrants | Chile | 59.0 /100 | #169 | Average 5.2% |
| Spanish | 55.9 /100 | #170 | Average 5.2% |
| Immigrants | Denmark | 55.0 /100 | #171 | Average 5.2% |
| Immigrants | Uganda | 50.7 /100 | #172 | Average 5.3% |
| Iranians | 50.4 /100 | #173 | Average 5.3% |
| Immigrants | Poland | 50.0 /100 | #174 | Average 5.3% |
| Immigrants | Laos | 47.5 /100 | #175 | Average 5.3% |
| Immigrants | Vietnam | 47.5 /100 | #176 | Average 5.3% |
| Immigrants | Morocco | 47.4 /100 | #177 | Average 5.3% |
| Immigrants | Southern Europe | 46.2 /100 | #178 | Average 5.3% |