Immigrants from Zimbabwe vs Ethiopian Male Unemployment
COMPARE
Immigrants from Zimbabwe
Ethiopian
Male Unemployment
Male Unemployment Comparison
Immigrants from Zimbabwe
Ethiopians
4.9%
MALE UNEMPLOYMENT
99.0/ 100
METRIC RATING
45th/ 347
METRIC RANK
5.1%
MALE UNEMPLOYMENT
91.3/ 100
METRIC RATING
107th/ 347
METRIC RANK
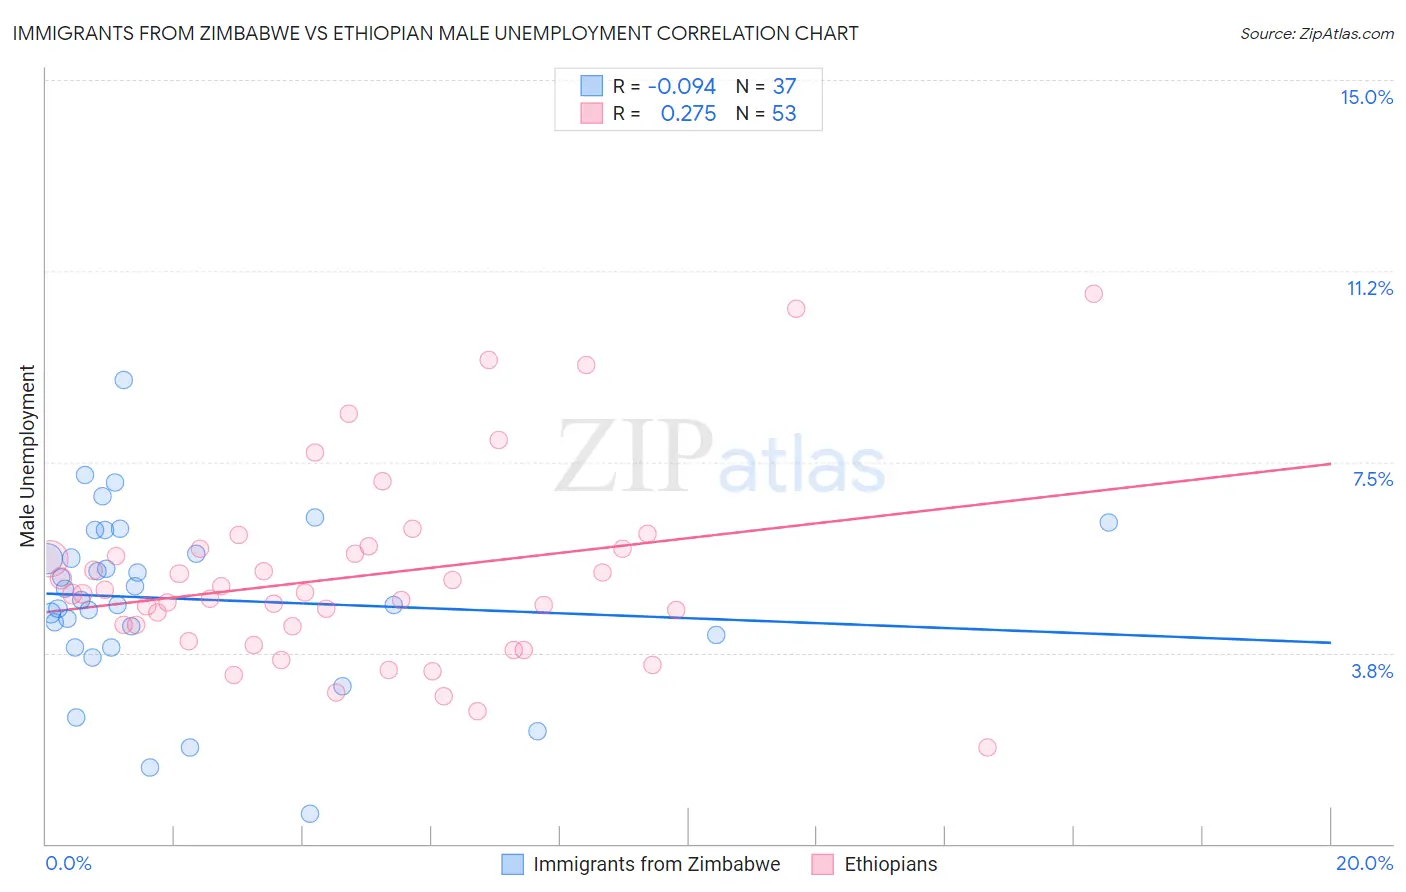
Immigrants from Zimbabwe vs Ethiopian Male Unemployment Correlation Chart
The statistical analysis conducted on geographies consisting of 117,685,167 people shows a slight negative correlation between the proportion of Immigrants from Zimbabwe and unemployment rate among males in the United States with a correlation coefficient (R) of -0.094 and weighted average of 4.9%. Similarly, the statistical analysis conducted on geographies consisting of 222,844,986 people shows a weak positive correlation between the proportion of Ethiopians and unemployment rate among males in the United States with a correlation coefficient (R) of 0.275 and weighted average of 5.1%, a difference of 3.5%.
Male Unemployment Correlation Summary
| Measurement | Immigrants from Zimbabwe | Ethiopian |
| Minimum | 0.60% | 1.9% |
| Maximum | 9.1% | 10.8% |
| Range | 8.5% | 8.9% |
| Mean | 4.8% | 5.3% |
| Median | 4.8% | 4.9% |
| Interquartile 25% (IQ1) | 4.0% | 4.1% |
| Interquartile 75% (IQ3) | 5.9% | 5.8% |
| Interquartile Range (IQR) | 1.9% | 1.7% |
| Standard Deviation (Sample) | 1.7% | 1.9% |
| Standard Deviation (Population) | 1.7% | 1.9% |
Similar Demographics by Male Unemployment
Demographics Similar to Immigrants from Zimbabwe by Male Unemployment
In terms of male unemployment, the demographic groups most similar to Immigrants from Zimbabwe are Bhutanese (4.9%, a difference of 0.090%), Immigrants from Korea (4.9%, a difference of 0.15%), Austrian (4.9%, a difference of 0.16%), Immigrants from Scotland (4.9%, a difference of 0.18%), and Polish (4.9%, a difference of 0.19%).
| Demographics | Rating | Rank | Male Unemployment |
| Immigrants | Bosnia and Herzegovina | 99.4 /100 | #38 | Exceptional 4.9% |
| Burmese | 99.3 /100 | #39 | Exceptional 4.9% |
| Northern Europeans | 99.3 /100 | #40 | Exceptional 4.9% |
| Chinese | 99.3 /100 | #41 | Exceptional 4.9% |
| Immigrants | Belgium | 99.2 /100 | #42 | Exceptional 4.9% |
| Immigrants | Japan | 99.2 /100 | #43 | Exceptional 4.9% |
| Immigrants | Korea | 99.1 /100 | #44 | Exceptional 4.9% |
| Immigrants | Zimbabwe | 99.0 /100 | #45 | Exceptional 4.9% |
| Bhutanese | 98.9 /100 | #46 | Exceptional 4.9% |
| Austrians | 98.9 /100 | #47 | Exceptional 4.9% |
| Immigrants | Scotland | 98.9 /100 | #48 | Exceptional 4.9% |
| Poles | 98.9 /100 | #49 | Exceptional 4.9% |
| Croatians | 98.9 /100 | #50 | Exceptional 4.9% |
| Slovenes | 98.8 /100 | #51 | Exceptional 5.0% |
| Irish | 98.8 /100 | #52 | Exceptional 5.0% |
Demographics Similar to Ethiopians by Male Unemployment
In terms of male unemployment, the demographic groups most similar to Ethiopians are Immigrants from Nicaragua (5.1%, a difference of 0.010%), Immigrants from Ethiopia (5.1%, a difference of 0.040%), Immigrants from Pakistan (5.1%, a difference of 0.070%), Immigrants from Czechoslovakia (5.1%, a difference of 0.080%), and Immigrants from Chile (5.1%, a difference of 0.090%).
| Demographics | Rating | Rank | Male Unemployment |
| Russians | 92.9 /100 | #100 | Exceptional 5.1% |
| German Russians | 92.7 /100 | #101 | Exceptional 5.1% |
| Immigrants | France | 92.7 /100 | #102 | Exceptional 5.1% |
| Immigrants | Jordan | 91.9 /100 | #103 | Exceptional 5.1% |
| Immigrants | Chile | 91.8 /100 | #104 | Exceptional 5.1% |
| Immigrants | Czechoslovakia | 91.7 /100 | #105 | Exceptional 5.1% |
| Immigrants | Ethiopia | 91.5 /100 | #106 | Exceptional 5.1% |
| Ethiopians | 91.3 /100 | #107 | Exceptional 5.1% |
| Immigrants | Nicaragua | 91.2 /100 | #108 | Exceptional 5.1% |
| Immigrants | Pakistan | 90.9 /100 | #109 | Exceptional 5.1% |
| Immigrants | England | 90.8 /100 | #110 | Exceptional 5.1% |
| Immigrants | Eastern Asia | 90.8 /100 | #111 | Exceptional 5.1% |
| Immigrants | Moldova | 90.3 /100 | #112 | Exceptional 5.1% |
| Immigrants | Austria | 90.3 /100 | #113 | Exceptional 5.1% |
| Romanians | 89.8 /100 | #114 | Excellent 5.1% |