Immigrants from Zimbabwe vs Ethiopian Master's Degree
COMPARE
Immigrants from Zimbabwe
Ethiopian
Master's Degree
Master's Degree Comparison
Immigrants from Zimbabwe
Ethiopians
17.4%
MASTER'S DEGREE
99.5/ 100
METRIC RATING
83rd/ 347
METRIC RANK
18.0%
MASTER'S DEGREE
99.8/ 100
METRIC RATING
66th/ 347
METRIC RANK
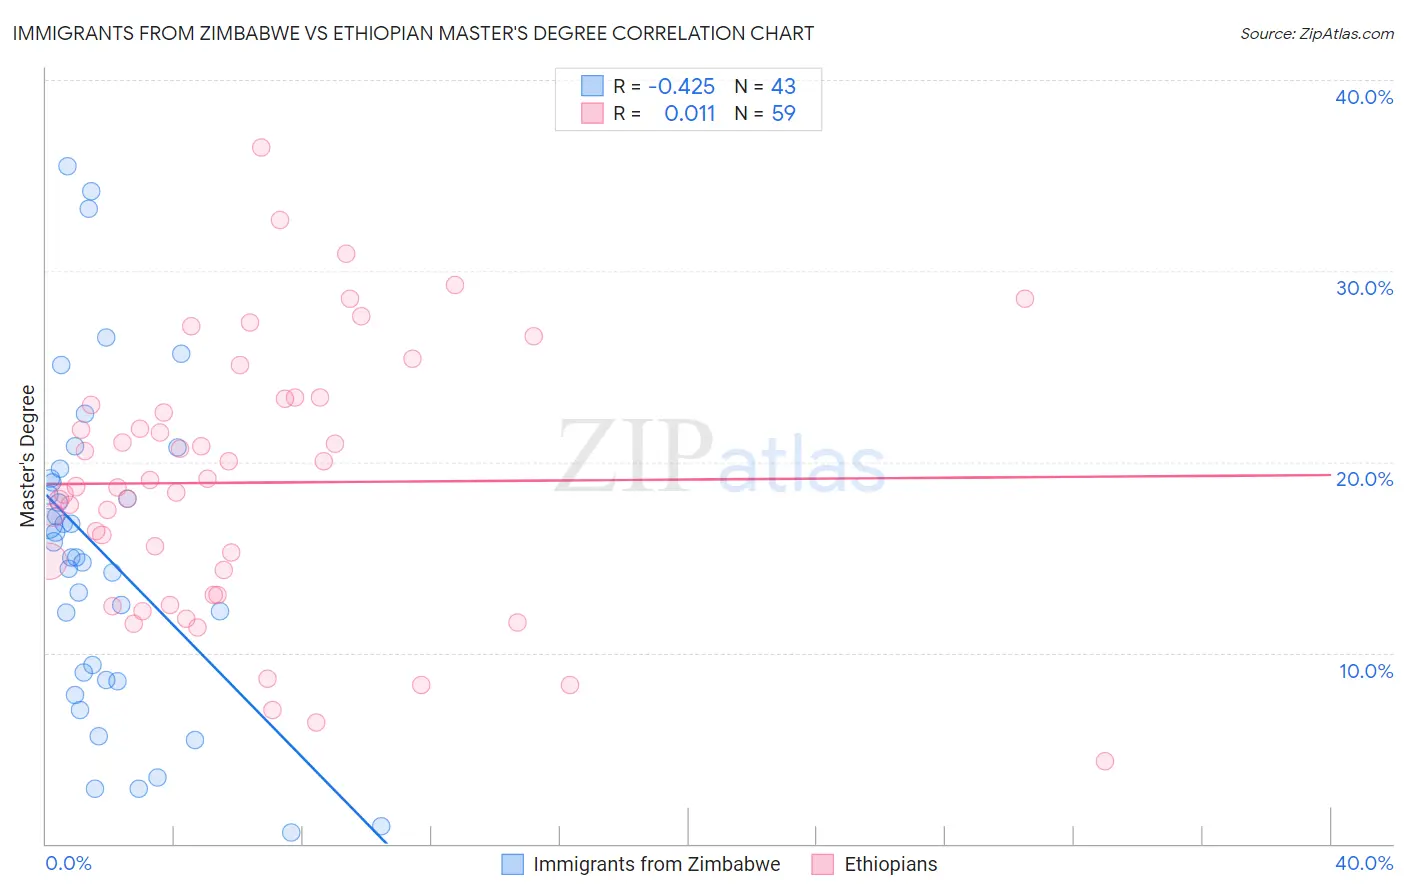
Immigrants from Zimbabwe vs Ethiopian Master's Degree Correlation Chart
The statistical analysis conducted on geographies consisting of 117,807,833 people shows a moderate negative correlation between the proportion of Immigrants from Zimbabwe and percentage of population with at least master's degree education in the United States with a correlation coefficient (R) of -0.425 and weighted average of 17.4%. Similarly, the statistical analysis conducted on geographies consisting of 223,155,116 people shows no correlation between the proportion of Ethiopians and percentage of population with at least master's degree education in the United States with a correlation coefficient (R) of 0.011 and weighted average of 18.0%, a difference of 3.0%.
Master's Degree Correlation Summary
| Measurement | Immigrants from Zimbabwe | Ethiopian |
| Minimum | 0.61% | 4.3% |
| Maximum | 35.5% | 36.4% |
| Range | 34.9% | 32.1% |
| Mean | 15.1% | 18.9% |
| Median | 15.0% | 18.7% |
| Interquartile 25% (IQ1) | 8.6% | 13.1% |
| Interquartile 75% (IQ3) | 19.1% | 23.3% |
| Interquartile Range (IQR) | 10.5% | 10.2% |
| Standard Deviation (Sample) | 8.4% | 6.9% |
| Standard Deviation (Population) | 8.3% | 6.8% |
Demographics Similar to Immigrants from Zimbabwe and Ethiopians by Master's Degree
In terms of master's degree, the demographic groups most similar to Immigrants from Zimbabwe are Greek (17.5%, a difference of 0.050%), Immigrants from Western Asia (17.5%, a difference of 0.11%), Immigrants from Scotland (17.4%, a difference of 0.33%), Carpatho Rusyn (17.5%, a difference of 0.40%), and Immigrants from Lebanon (17.5%, a difference of 0.46%). Similarly, the demographic groups most similar to Ethiopians are Immigrants from Kazakhstan (18.0%, a difference of 0.020%), Immigrants from Argentina (18.0%, a difference of 0.050%), Immigrants from Ethiopia (17.9%, a difference of 0.27%), Immigrants from Uzbekistan (17.9%, a difference of 0.60%), and South African (18.1%, a difference of 0.73%).
| Demographics | Rating | Rank | Master's Degree |
| South Africans | 99.9 /100 | #64 | Exceptional 18.1% |
| Immigrants | Kazakhstan | 99.8 /100 | #65 | Exceptional 18.0% |
| Ethiopians | 99.8 /100 | #66 | Exceptional 18.0% |
| Immigrants | Argentina | 99.8 /100 | #67 | Exceptional 18.0% |
| Immigrants | Ethiopia | 99.8 /100 | #68 | Exceptional 17.9% |
| Immigrants | Uzbekistan | 99.8 /100 | #69 | Exceptional 17.9% |
| Immigrants | Western Europe | 99.8 /100 | #70 | Exceptional 17.8% |
| Immigrants | Pakistan | 99.7 /100 | #71 | Exceptional 17.8% |
| Lithuanians | 99.7 /100 | #72 | Exceptional 17.7% |
| Zimbabweans | 99.7 /100 | #73 | Exceptional 17.7% |
| Immigrants | Romania | 99.7 /100 | #74 | Exceptional 17.7% |
| Egyptians | 99.6 /100 | #75 | Exceptional 17.6% |
| Immigrants | Indonesia | 99.6 /100 | #76 | Exceptional 17.6% |
| Immigrants | Eastern Europe | 99.6 /100 | #77 | Exceptional 17.6% |
| Immigrants | Hungary | 99.6 /100 | #78 | Exceptional 17.5% |
| Immigrants | Lebanon | 99.6 /100 | #79 | Exceptional 17.5% |
| Carpatho Rusyns | 99.6 /100 | #80 | Exceptional 17.5% |
| Immigrants | Western Asia | 99.5 /100 | #81 | Exceptional 17.5% |
| Greeks | 99.5 /100 | #82 | Exceptional 17.5% |
| Immigrants | Zimbabwe | 99.5 /100 | #83 | Exceptional 17.4% |
| Immigrants | Scotland | 99.4 /100 | #84 | Exceptional 17.4% |