Immigrants from Zimbabwe vs Greek Male Unemployment
COMPARE
Immigrants from Zimbabwe
Greek
Male Unemployment
Male Unemployment Comparison
Immigrants from Zimbabwe
Greeks
4.9%
MALE UNEMPLOYMENT
99.0/ 100
METRIC RATING
45th/ 347
METRIC RANK
5.0%
MALE UNEMPLOYMENT
97.0/ 100
METRIC RATING
73rd/ 347
METRIC RANK
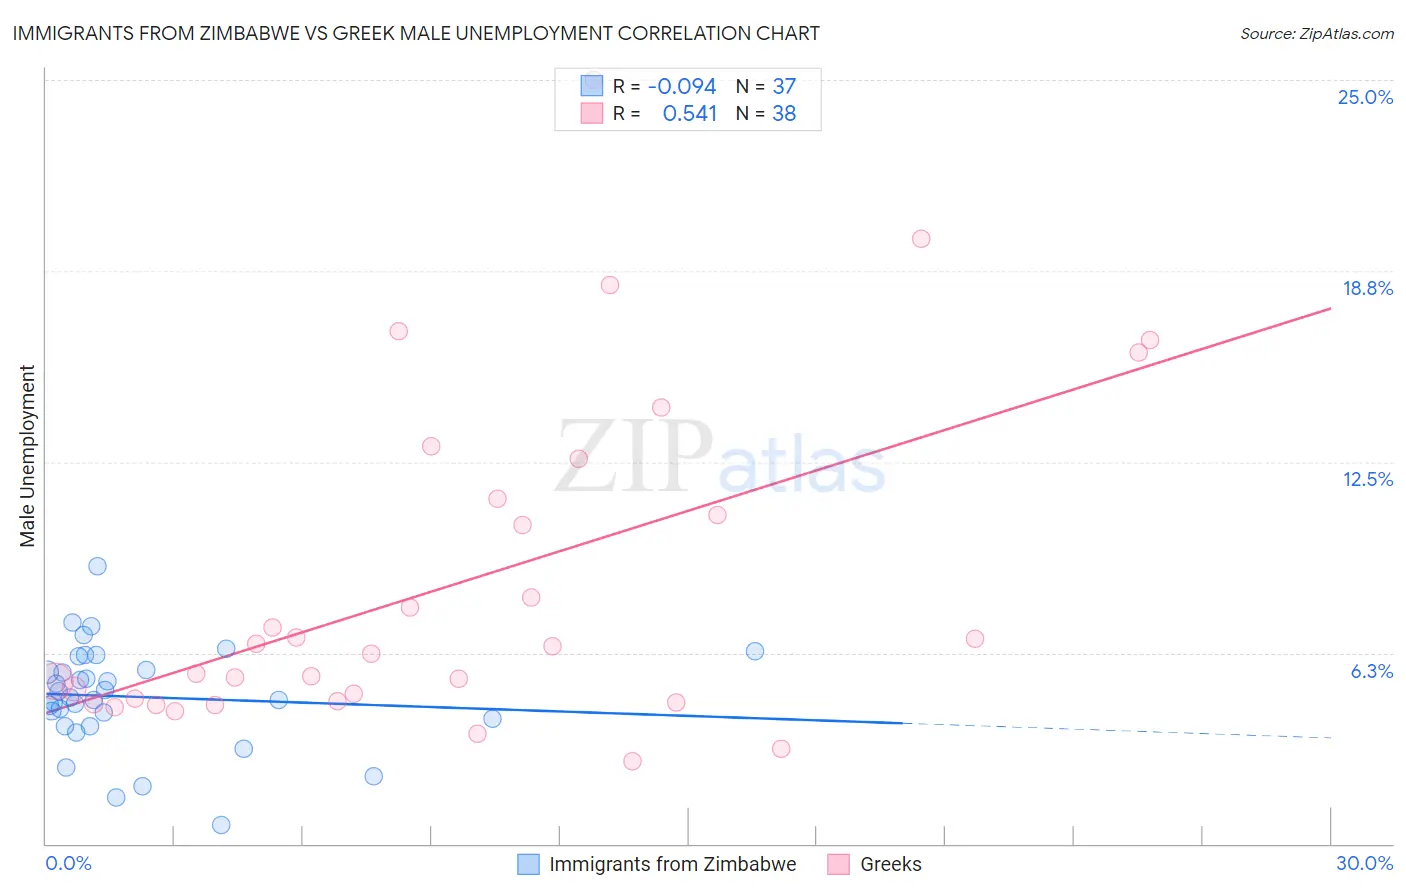
Immigrants from Zimbabwe vs Greek Male Unemployment Correlation Chart
The statistical analysis conducted on geographies consisting of 117,685,167 people shows a slight negative correlation between the proportion of Immigrants from Zimbabwe and unemployment rate among males in the United States with a correlation coefficient (R) of -0.094 and weighted average of 4.9%. Similarly, the statistical analysis conducted on geographies consisting of 479,076,268 people shows a substantial positive correlation between the proportion of Greeks and unemployment rate among males in the United States with a correlation coefficient (R) of 0.541 and weighted average of 5.0%, a difference of 1.8%.
Male Unemployment Correlation Summary
| Measurement | Immigrants from Zimbabwe | Greek |
| Minimum | 0.60% | 2.7% |
| Maximum | 9.1% | 25.0% |
| Range | 8.5% | 22.3% |
| Mean | 4.8% | 8.5% |
| Median | 4.8% | 6.3% |
| Interquartile 25% (IQ1) | 4.0% | 4.7% |
| Interquartile 75% (IQ3) | 5.9% | 11.3% |
| Interquartile Range (IQR) | 1.9% | 6.6% |
| Standard Deviation (Sample) | 1.7% | 5.4% |
| Standard Deviation (Population) | 1.7% | 5.3% |
Similar Demographics by Male Unemployment
Demographics Similar to Immigrants from Zimbabwe by Male Unemployment
In terms of male unemployment, the demographic groups most similar to Immigrants from Zimbabwe are Bhutanese (4.9%, a difference of 0.090%), Immigrants from Korea (4.9%, a difference of 0.15%), Austrian (4.9%, a difference of 0.16%), Immigrants from Scotland (4.9%, a difference of 0.18%), and Polish (4.9%, a difference of 0.19%).
| Demographics | Rating | Rank | Male Unemployment |
| Immigrants | Bosnia and Herzegovina | 99.4 /100 | #38 | Exceptional 4.9% |
| Burmese | 99.3 /100 | #39 | Exceptional 4.9% |
| Northern Europeans | 99.3 /100 | #40 | Exceptional 4.9% |
| Chinese | 99.3 /100 | #41 | Exceptional 4.9% |
| Immigrants | Belgium | 99.2 /100 | #42 | Exceptional 4.9% |
| Immigrants | Japan | 99.2 /100 | #43 | Exceptional 4.9% |
| Immigrants | Korea | 99.1 /100 | #44 | Exceptional 4.9% |
| Immigrants | Zimbabwe | 99.0 /100 | #45 | Exceptional 4.9% |
| Bhutanese | 98.9 /100 | #46 | Exceptional 4.9% |
| Austrians | 98.9 /100 | #47 | Exceptional 4.9% |
| Immigrants | Scotland | 98.9 /100 | #48 | Exceptional 4.9% |
| Poles | 98.9 /100 | #49 | Exceptional 4.9% |
| Croatians | 98.9 /100 | #50 | Exceptional 4.9% |
| Slovenes | 98.8 /100 | #51 | Exceptional 5.0% |
| Irish | 98.8 /100 | #52 | Exceptional 5.0% |
Demographics Similar to Greeks by Male Unemployment
In terms of male unemployment, the demographic groups most similar to Greeks are Immigrants from North America (5.0%, a difference of 0.030%), Assyrian/Chaldean/Syriac (5.0%, a difference of 0.060%), Immigrants from South Africa (5.0%, a difference of 0.080%), New Zealander (5.0%, a difference of 0.16%), and White/Caucasian (5.0%, a difference of 0.18%).
| Demographics | Rating | Rank | Male Unemployment |
| Finns | 97.5 /100 | #66 | Exceptional 5.0% |
| Immigrants | Canada | 97.5 /100 | #67 | Exceptional 5.0% |
| Australians | 97.4 /100 | #68 | Exceptional 5.0% |
| Immigrants | Sweden | 97.4 /100 | #69 | Exceptional 5.0% |
| Whites/Caucasians | 97.3 /100 | #70 | Exceptional 5.0% |
| New Zealanders | 97.3 /100 | #71 | Exceptional 5.0% |
| Immigrants | South Africa | 97.1 /100 | #72 | Exceptional 5.0% |
| Greeks | 97.0 /100 | #73 | Exceptional 5.0% |
| Immigrants | North America | 96.9 /100 | #74 | Exceptional 5.0% |
| Assyrians/Chaldeans/Syriacs | 96.9 /100 | #75 | Exceptional 5.0% |
| Immigrants | Sudan | 96.5 /100 | #76 | Exceptional 5.0% |
| Iranians | 96.4 /100 | #77 | Exceptional 5.0% |
| Immigrants | Northern Europe | 96.4 /100 | #78 | Exceptional 5.0% |
| South Africans | 96.4 /100 | #79 | Exceptional 5.0% |
| Argentineans | 96.2 /100 | #80 | Exceptional 5.0% |