Immigrants from Western Europe vs Immigrants from Peru Unemployment
COMPARE
Immigrants from Western Europe
Immigrants from Peru
Unemployment
Unemployment Comparison
Immigrants from Western Europe
Immigrants from Peru
5.1%
UNEMPLOYMENT
91.1/ 100
METRIC RATING
115th/ 347
METRIC RANK
5.4%
UNEMPLOYMENT
22.7/ 100
METRIC RATING
206th/ 347
METRIC RANK
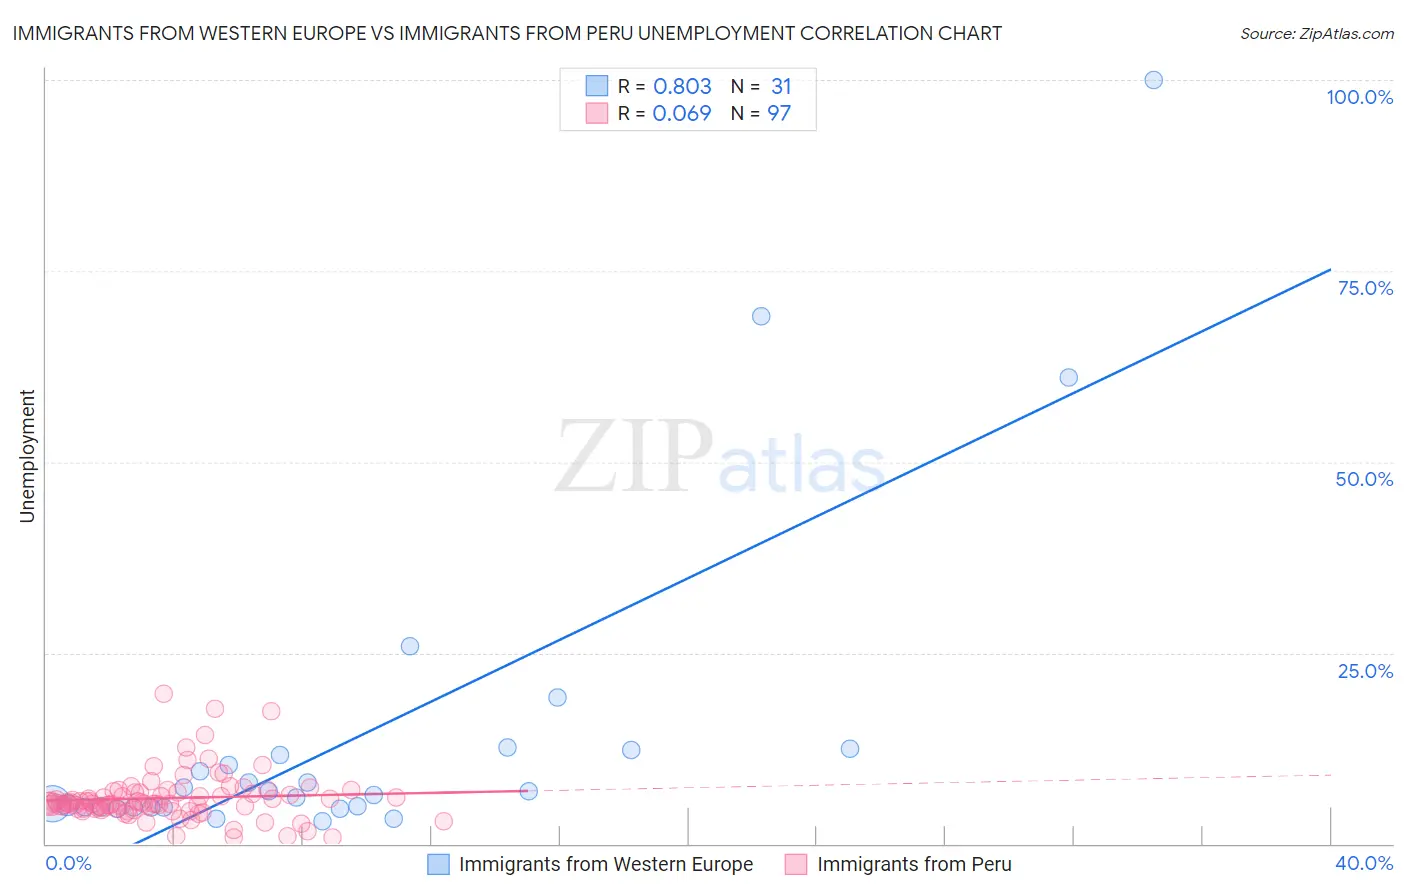
Immigrants from Western Europe vs Immigrants from Peru Unemployment Correlation Chart
The statistical analysis conducted on geographies consisting of 492,944,202 people shows a very strong positive correlation between the proportion of Immigrants from Western Europe and unemployment in the United States with a correlation coefficient (R) of 0.803 and weighted average of 5.1%. Similarly, the statistical analysis conducted on geographies consisting of 328,656,661 people shows a slight positive correlation between the proportion of Immigrants from Peru and unemployment in the United States with a correlation coefficient (R) of 0.069 and weighted average of 5.4%, a difference of 5.7%.
Unemployment Correlation Summary
| Measurement | Immigrants from Western Europe | Immigrants from Peru |
| Minimum | 2.9% | 0.80% |
| Maximum | 100.0% | 19.6% |
| Range | 97.1% | 18.8% |
| Mean | 14.5% | 6.0% |
| Median | 6.8% | 5.3% |
| Interquartile 25% (IQ1) | 4.8% | 4.6% |
| Interquartile 75% (IQ3) | 12.2% | 6.7% |
| Interquartile Range (IQR) | 7.4% | 2.1% |
| Standard Deviation (Sample) | 21.9% | 3.2% |
| Standard Deviation (Population) | 21.5% | 3.1% |
Similar Demographics by Unemployment
Demographics Similar to Immigrants from Western Europe by Unemployment
In terms of unemployment, the demographic groups most similar to Immigrants from Western Europe are Immigrants from Sri Lanka (5.1%, a difference of 0.010%), Immigrants from Malaysia (5.1%, a difference of 0.030%), Immigrants from Germany (5.1%, a difference of 0.070%), Immigrants from Ireland (5.1%, a difference of 0.21%), and Argentinean (5.1%, a difference of 0.27%).
| Demographics | Rating | Rank | Unemployment |
| Immigrants | Kuwait | 93.7 /100 | #108 | Exceptional 5.0% |
| Immigrants | Eritrea | 93.3 /100 | #109 | Exceptional 5.0% |
| Immigrants | Lithuania | 93.2 /100 | #110 | Exceptional 5.0% |
| Chileans | 93.2 /100 | #111 | Exceptional 5.0% |
| South Africans | 92.6 /100 | #112 | Exceptional 5.1% |
| Argentineans | 92.4 /100 | #113 | Exceptional 5.1% |
| Immigrants | Ireland | 92.1 /100 | #114 | Exceptional 5.1% |
| Immigrants | Western Europe | 91.1 /100 | #115 | Exceptional 5.1% |
| Immigrants | Sri Lanka | 91.1 /100 | #116 | Exceptional 5.1% |
| Immigrants | Malaysia | 91.0 /100 | #117 | Exceptional 5.1% |
| Immigrants | Germany | 90.8 /100 | #118 | Exceptional 5.1% |
| Immigrants | France | 89.7 /100 | #119 | Excellent 5.1% |
| Macedonians | 89.7 /100 | #120 | Excellent 5.1% |
| Lebanese | 89.2 /100 | #121 | Excellent 5.1% |
| Immigrants | Switzerland | 89.1 /100 | #122 | Excellent 5.1% |
Demographics Similar to Immigrants from Peru by Unemployment
In terms of unemployment, the demographic groups most similar to Immigrants from Peru are Native Hawaiian (5.3%, a difference of 0.13%), Immigrants from Ukraine (5.3%, a difference of 0.18%), Immigrants from Micronesia (5.3%, a difference of 0.21%), Cherokee (5.3%, a difference of 0.24%), and Creek (5.4%, a difference of 0.30%).
| Demographics | Rating | Rank | Unemployment |
| Immigrants | Afghanistan | 28.6 /100 | #199 | Fair 5.3% |
| Koreans | 27.4 /100 | #200 | Fair 5.3% |
| Immigrants | South Eastern Asia | 27.0 /100 | #201 | Fair 5.3% |
| Cherokee | 25.5 /100 | #202 | Fair 5.3% |
| Immigrants | Micronesia | 25.2 /100 | #203 | Fair 5.3% |
| Immigrants | Ukraine | 24.9 /100 | #204 | Fair 5.3% |
| Native Hawaiians | 24.1 /100 | #205 | Fair 5.3% |
| Immigrants | Peru | 22.7 /100 | #206 | Fair 5.4% |
| Creek | 19.4 /100 | #207 | Poor 5.4% |
| Portuguese | 19.0 /100 | #208 | Poor 5.4% |
| Immigrants | Iran | 18.8 /100 | #209 | Poor 5.4% |
| Immigrants | Iraq | 18.6 /100 | #210 | Poor 5.4% |
| Iraqis | 18.1 /100 | #211 | Poor 5.4% |
| Ugandans | 18.0 /100 | #212 | Poor 5.4% |
| Immigrants | Middle Africa | 15.3 /100 | #213 | Poor 5.4% |