Immigrants from Western Europe vs Iranian Unemployment
COMPARE
Immigrants from Western Europe
Iranian
Unemployment
Unemployment Comparison
Immigrants from Western Europe
Iranians
5.1%
UNEMPLOYMENT
91.1/ 100
METRIC RATING
115th/ 347
METRIC RANK
5.1%
UNEMPLOYMENT
86.9/ 100
METRIC RATING
130th/ 347
METRIC RANK
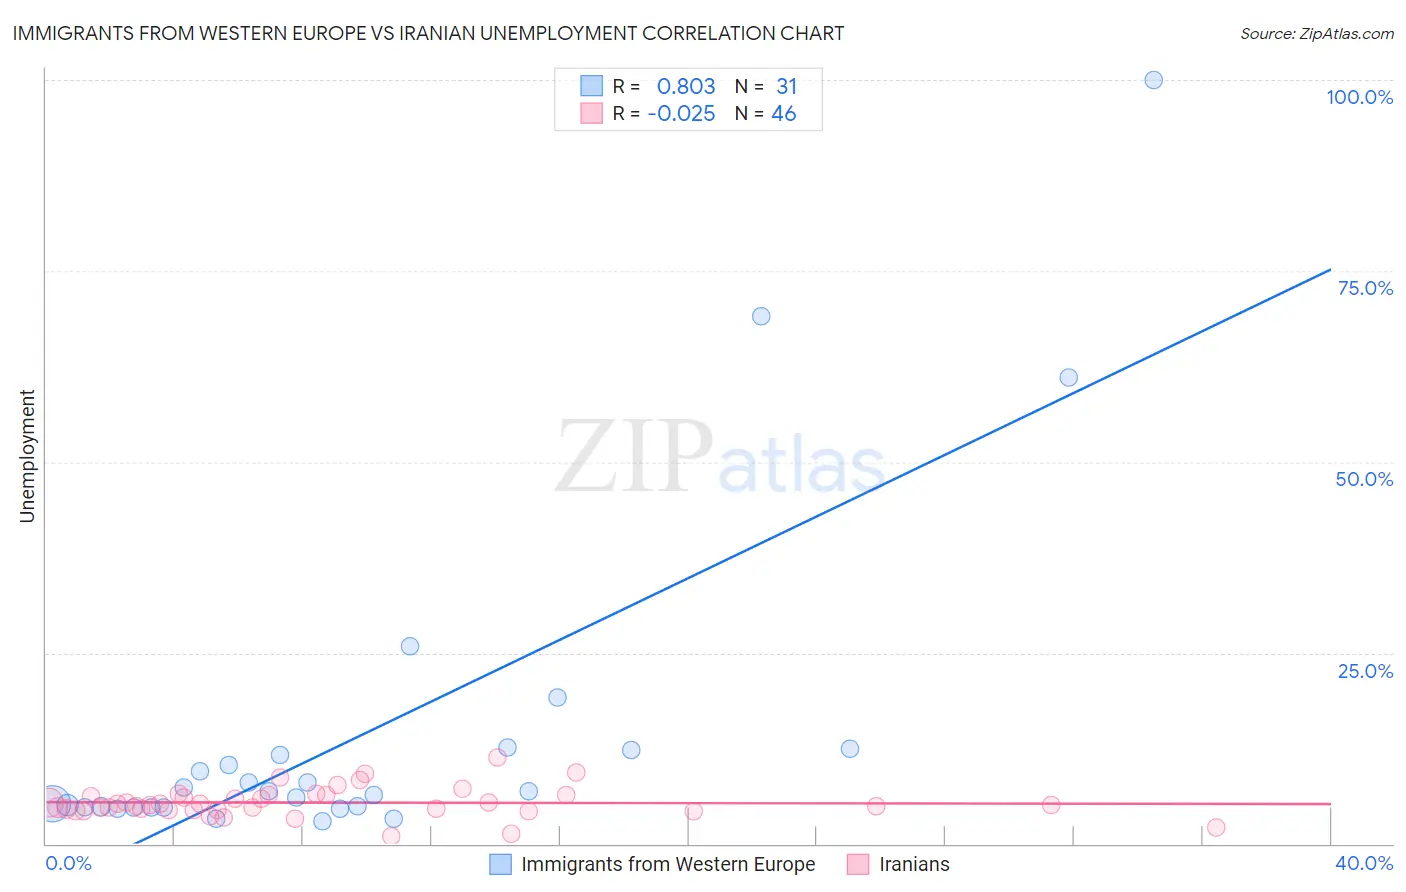
Immigrants from Western Europe vs Iranian Unemployment Correlation Chart
The statistical analysis conducted on geographies consisting of 492,944,202 people shows a very strong positive correlation between the proportion of Immigrants from Western Europe and unemployment in the United States with a correlation coefficient (R) of 0.803 and weighted average of 5.1%. Similarly, the statistical analysis conducted on geographies consisting of 316,755,420 people shows no correlation between the proportion of Iranians and unemployment in the United States with a correlation coefficient (R) of -0.025 and weighted average of 5.1%, a difference of 0.70%.
Unemployment Correlation Summary
| Measurement | Immigrants from Western Europe | Iranian |
| Minimum | 2.9% | 1.0% |
| Maximum | 100.0% | 11.3% |
| Range | 97.1% | 10.3% |
| Mean | 14.5% | 5.4% |
| Median | 6.8% | 5.1% |
| Interquartile 25% (IQ1) | 4.8% | 4.4% |
| Interquartile 75% (IQ3) | 12.2% | 6.3% |
| Interquartile Range (IQR) | 7.4% | 1.9% |
| Standard Deviation (Sample) | 21.9% | 1.9% |
| Standard Deviation (Population) | 21.5% | 1.9% |
Demographics Similar to Immigrants from Western Europe and Iranians by Unemployment
In terms of unemployment, the demographic groups most similar to Immigrants from Western Europe are Immigrants from Sri Lanka (5.1%, a difference of 0.010%), Immigrants from Malaysia (5.1%, a difference of 0.030%), Immigrants from Germany (5.1%, a difference of 0.070%), Immigrants from Ireland (5.1%, a difference of 0.21%), and Argentinean (5.1%, a difference of 0.27%). Similarly, the demographic groups most similar to Iranians are Immigrants from Croatia (5.1%, a difference of 0.030%), Immigrants from Ethiopia (5.1%, a difference of 0.030%), Immigrants from Eastern Africa (5.1%, a difference of 0.16%), Immigrants from Latvia (5.1%, a difference of 0.16%), and Kenyan (5.1%, a difference of 0.18%).
| Demographics | Rating | Rank | Unemployment |
| South Africans | 92.6 /100 | #112 | Exceptional 5.1% |
| Argentineans | 92.4 /100 | #113 | Exceptional 5.1% |
| Immigrants | Ireland | 92.1 /100 | #114 | Exceptional 5.1% |
| Immigrants | Western Europe | 91.1 /100 | #115 | Exceptional 5.1% |
| Immigrants | Sri Lanka | 91.1 /100 | #116 | Exceptional 5.1% |
| Immigrants | Malaysia | 91.0 /100 | #117 | Exceptional 5.1% |
| Immigrants | Germany | 90.8 /100 | #118 | Exceptional 5.1% |
| Immigrants | France | 89.7 /100 | #119 | Excellent 5.1% |
| Macedonians | 89.7 /100 | #120 | Excellent 5.1% |
| Lebanese | 89.2 /100 | #121 | Excellent 5.1% |
| Immigrants | Switzerland | 89.1 /100 | #122 | Excellent 5.1% |
| Asians | 89.0 /100 | #123 | Excellent 5.1% |
| Ethiopians | 88.6 /100 | #124 | Excellent 5.1% |
| Immigrants | Eastern Asia | 88.3 /100 | #125 | Excellent 5.1% |
| Kenyans | 88.2 /100 | #126 | Excellent 5.1% |
| Immigrants | Kenya | 88.2 /100 | #127 | Excellent 5.1% |
| Immigrants | Eastern Africa | 88.1 /100 | #128 | Excellent 5.1% |
| Immigrants | Latvia | 88.0 /100 | #129 | Excellent 5.1% |
| Iranians | 86.9 /100 | #130 | Excellent 5.1% |
| Immigrants | Croatia | 86.8 /100 | #131 | Excellent 5.1% |
| Immigrants | Ethiopia | 86.7 /100 | #132 | Excellent 5.1% |