Immigrants from Western Europe vs Creek Unemployment
COMPARE
Immigrants from Western Europe
Creek
Unemployment
Unemployment Comparison
Immigrants from Western Europe
Creek
5.1%
UNEMPLOYMENT
91.1/ 100
METRIC RATING
115th/ 347
METRIC RANK
5.4%
UNEMPLOYMENT
19.4/ 100
METRIC RATING
207th/ 347
METRIC RANK
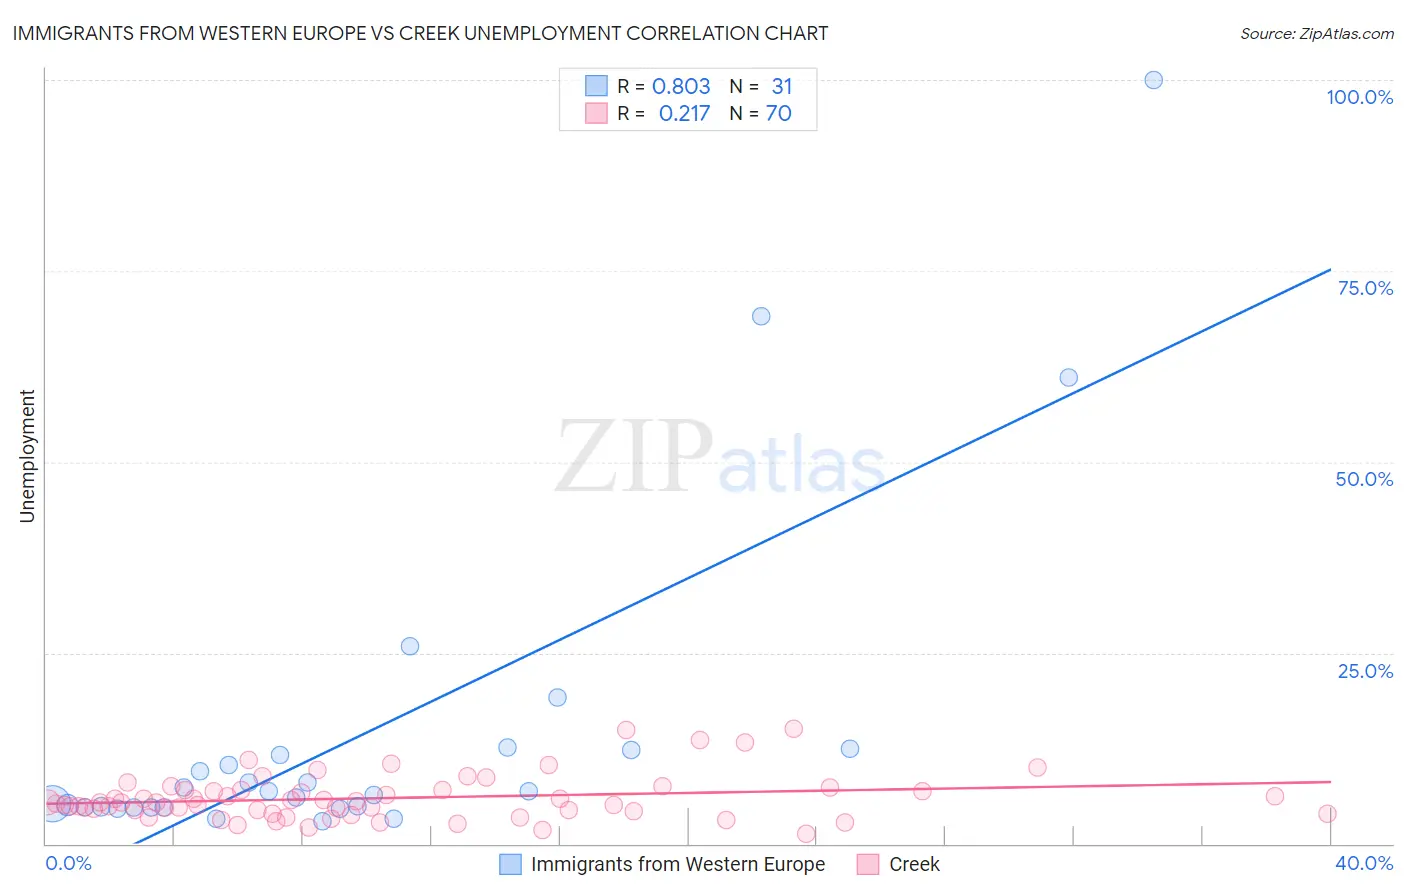
Immigrants from Western Europe vs Creek Unemployment Correlation Chart
The statistical analysis conducted on geographies consisting of 492,944,202 people shows a very strong positive correlation between the proportion of Immigrants from Western Europe and unemployment in the United States with a correlation coefficient (R) of 0.803 and weighted average of 5.1%. Similarly, the statistical analysis conducted on geographies consisting of 178,280,208 people shows a weak positive correlation between the proportion of Creek and unemployment in the United States with a correlation coefficient (R) of 0.217 and weighted average of 5.4%, a difference of 6.0%.
Unemployment Correlation Summary
| Measurement | Immigrants from Western Europe | Creek |
| Minimum | 2.9% | 1.3% |
| Maximum | 100.0% | 15.0% |
| Range | 97.1% | 13.7% |
| Mean | 14.5% | 6.0% |
| Median | 6.8% | 5.4% |
| Interquartile 25% (IQ1) | 4.8% | 4.3% |
| Interquartile 75% (IQ3) | 12.2% | 7.1% |
| Interquartile Range (IQR) | 7.4% | 2.8% |
| Standard Deviation (Sample) | 21.9% | 2.9% |
| Standard Deviation (Population) | 21.5% | 2.9% |
Similar Demographics by Unemployment
Demographics Similar to Immigrants from Western Europe by Unemployment
In terms of unemployment, the demographic groups most similar to Immigrants from Western Europe are Immigrants from Sri Lanka (5.1%, a difference of 0.010%), Immigrants from Malaysia (5.1%, a difference of 0.030%), Immigrants from Germany (5.1%, a difference of 0.070%), Immigrants from Ireland (5.1%, a difference of 0.21%), and Argentinean (5.1%, a difference of 0.27%).
| Demographics | Rating | Rank | Unemployment |
| Immigrants | Kuwait | 93.7 /100 | #108 | Exceptional 5.0% |
| Immigrants | Eritrea | 93.3 /100 | #109 | Exceptional 5.0% |
| Immigrants | Lithuania | 93.2 /100 | #110 | Exceptional 5.0% |
| Chileans | 93.2 /100 | #111 | Exceptional 5.0% |
| South Africans | 92.6 /100 | #112 | Exceptional 5.1% |
| Argentineans | 92.4 /100 | #113 | Exceptional 5.1% |
| Immigrants | Ireland | 92.1 /100 | #114 | Exceptional 5.1% |
| Immigrants | Western Europe | 91.1 /100 | #115 | Exceptional 5.1% |
| Immigrants | Sri Lanka | 91.1 /100 | #116 | Exceptional 5.1% |
| Immigrants | Malaysia | 91.0 /100 | #117 | Exceptional 5.1% |
| Immigrants | Germany | 90.8 /100 | #118 | Exceptional 5.1% |
| Immigrants | France | 89.7 /100 | #119 | Excellent 5.1% |
| Macedonians | 89.7 /100 | #120 | Excellent 5.1% |
| Lebanese | 89.2 /100 | #121 | Excellent 5.1% |
| Immigrants | Switzerland | 89.1 /100 | #122 | Excellent 5.1% |
Demographics Similar to Creek by Unemployment
In terms of unemployment, the demographic groups most similar to Creek are Portuguese (5.4%, a difference of 0.030%), Immigrants from Iran (5.4%, a difference of 0.060%), Immigrants from Iraq (5.4%, a difference of 0.080%), Iraqi (5.4%, a difference of 0.13%), and Ugandan (5.4%, a difference of 0.14%).
| Demographics | Rating | Rank | Unemployment |
| Koreans | 27.4 /100 | #200 | Fair 5.3% |
| Immigrants | South Eastern Asia | 27.0 /100 | #201 | Fair 5.3% |
| Cherokee | 25.5 /100 | #202 | Fair 5.3% |
| Immigrants | Micronesia | 25.2 /100 | #203 | Fair 5.3% |
| Immigrants | Ukraine | 24.9 /100 | #204 | Fair 5.3% |
| Native Hawaiians | 24.1 /100 | #205 | Fair 5.3% |
| Immigrants | Peru | 22.7 /100 | #206 | Fair 5.4% |
| Creek | 19.4 /100 | #207 | Poor 5.4% |
| Portuguese | 19.0 /100 | #208 | Poor 5.4% |
| Immigrants | Iran | 18.8 /100 | #209 | Poor 5.4% |
| Immigrants | Iraq | 18.6 /100 | #210 | Poor 5.4% |
| Iraqis | 18.1 /100 | #211 | Poor 5.4% |
| Ugandans | 18.0 /100 | #212 | Poor 5.4% |
| Immigrants | Middle Africa | 15.3 /100 | #213 | Poor 5.4% |
| Immigrants | Costa Rica | 15.2 /100 | #214 | Poor 5.4% |