British West Indian vs Iranian Unemployment
COMPARE
British West Indian
Iranian
Unemployment
Unemployment Comparison
British West Indians
Iranians
6.8%
UNEMPLOYMENT
0.0/ 100
METRIC RATING
319th/ 347
METRIC RANK
5.1%
UNEMPLOYMENT
86.9/ 100
METRIC RATING
130th/ 347
METRIC RANK
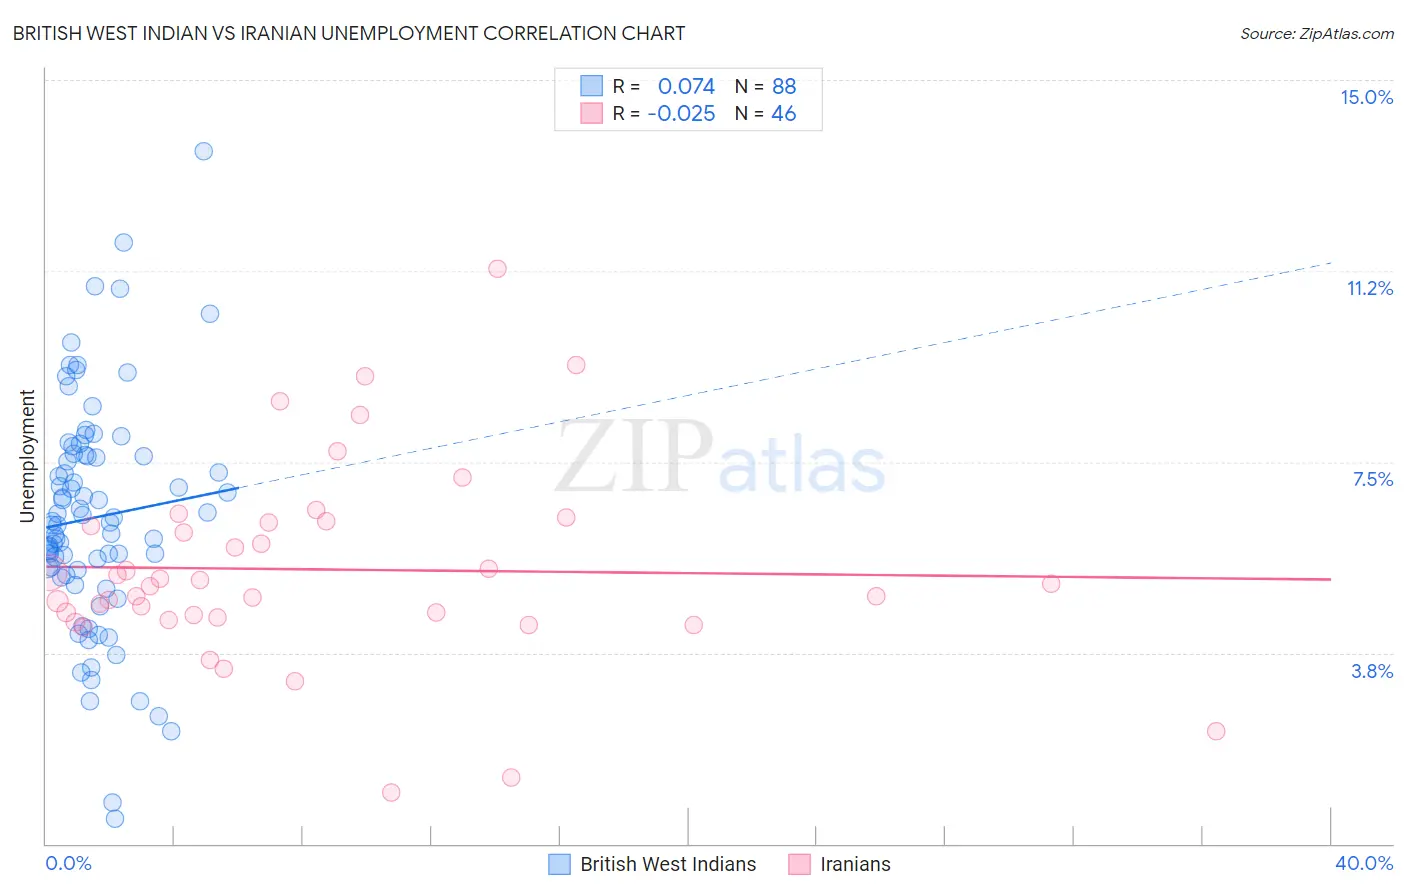
British West Indian vs Iranian Unemployment Correlation Chart
The statistical analysis conducted on geographies consisting of 152,665,255 people shows a slight positive correlation between the proportion of British West Indians and unemployment in the United States with a correlation coefficient (R) of 0.074 and weighted average of 6.8%. Similarly, the statistical analysis conducted on geographies consisting of 316,755,420 people shows no correlation between the proportion of Iranians and unemployment in the United States with a correlation coefficient (R) of -0.025 and weighted average of 5.1%, a difference of 33.9%.
Unemployment Correlation Summary
| Measurement | British West Indian | Iranian |
| Minimum | 0.50% | 1.0% |
| Maximum | 13.6% | 11.3% |
| Range | 13.1% | 10.3% |
| Mean | 6.4% | 5.4% |
| Median | 6.3% | 5.1% |
| Interquartile 25% (IQ1) | 5.3% | 4.4% |
| Interquartile 75% (IQ3) | 7.6% | 6.3% |
| Interquartile Range (IQR) | 2.3% | 1.9% |
| Standard Deviation (Sample) | 2.3% | 1.9% |
| Standard Deviation (Population) | 2.3% | 1.9% |
Similar Demographics by Unemployment
Demographics Similar to British West Indians by Unemployment
In terms of unemployment, the demographic groups most similar to British West Indians are Immigrants from Cabo Verde (6.8%, a difference of 0.21%), Immigrants from St. Vincent and the Grenadines (6.9%, a difference of 0.79%), Shoshone (6.8%, a difference of 0.81%), Immigrants from Guyana (6.9%, a difference of 0.81%), and Guyanese (6.9%, a difference of 0.85%).
| Demographics | Rating | Rank | Unemployment |
| Colville | 0.0 /100 | #312 | Tragic 6.6% |
| Immigrants | Barbados | 0.0 /100 | #313 | Tragic 6.6% |
| Blacks/African Americans | 0.0 /100 | #314 | Tragic 6.6% |
| Houma | 0.0 /100 | #315 | Tragic 6.7% |
| Immigrants | Dominica | 0.0 /100 | #316 | Tragic 6.7% |
| Shoshone | 0.0 /100 | #317 | Tragic 6.8% |
| Immigrants | Cabo Verde | 0.0 /100 | #318 | Tragic 6.8% |
| British West Indians | 0.0 /100 | #319 | Tragic 6.8% |
| Immigrants | St. Vincent and the Grenadines | 0.0 /100 | #320 | Tragic 6.9% |
| Immigrants | Guyana | 0.0 /100 | #321 | Tragic 6.9% |
| Guyanese | 0.0 /100 | #322 | Tragic 6.9% |
| Immigrants | Grenada | 0.0 /100 | #323 | Tragic 6.9% |
| Immigrants | Armenia | 0.0 /100 | #324 | Tragic 7.0% |
| Natives/Alaskans | 0.0 /100 | #325 | Tragic 7.0% |
| Paiute | 0.0 /100 | #326 | Tragic 7.1% |
Demographics Similar to Iranians by Unemployment
In terms of unemployment, the demographic groups most similar to Iranians are Immigrants from Croatia (5.1%, a difference of 0.030%), Immigrants from Ethiopia (5.1%, a difference of 0.030%), Immigrants from Jordan (5.1%, a difference of 0.040%), Immigrants from Europe (5.1%, a difference of 0.090%), and Immigrants from Burma/Myanmar (5.1%, a difference of 0.090%).
| Demographics | Rating | Rank | Unemployment |
| Asians | 89.0 /100 | #123 | Excellent 5.1% |
| Ethiopians | 88.6 /100 | #124 | Excellent 5.1% |
| Immigrants | Eastern Asia | 88.3 /100 | #125 | Excellent 5.1% |
| Kenyans | 88.2 /100 | #126 | Excellent 5.1% |
| Immigrants | Kenya | 88.2 /100 | #127 | Excellent 5.1% |
| Immigrants | Eastern Africa | 88.1 /100 | #128 | Excellent 5.1% |
| Immigrants | Latvia | 88.0 /100 | #129 | Excellent 5.1% |
| Iranians | 86.9 /100 | #130 | Excellent 5.1% |
| Immigrants | Croatia | 86.8 /100 | #131 | Excellent 5.1% |
| Immigrants | Ethiopia | 86.7 /100 | #132 | Excellent 5.1% |
| Immigrants | Jordan | 86.6 /100 | #133 | Excellent 5.1% |
| Immigrants | Europe | 86.3 /100 | #134 | Excellent 5.1% |
| Immigrants | Burma/Myanmar | 86.2 /100 | #135 | Excellent 5.1% |
| Immigrants | Spain | 86.2 /100 | #136 | Excellent 5.1% |
| Immigrants | Saudi Arabia | 85.6 /100 | #137 | Excellent 5.1% |