Immigrants from Cambodia vs Iranian Unemployment
COMPARE
Immigrants from Cambodia
Iranian
Unemployment
Unemployment Comparison
Immigrants from Cambodia
Iranians
5.5%
UNEMPLOYMENT
3.3/ 100
METRIC RATING
236th/ 347
METRIC RANK
5.1%
UNEMPLOYMENT
86.9/ 100
METRIC RATING
130th/ 347
METRIC RANK
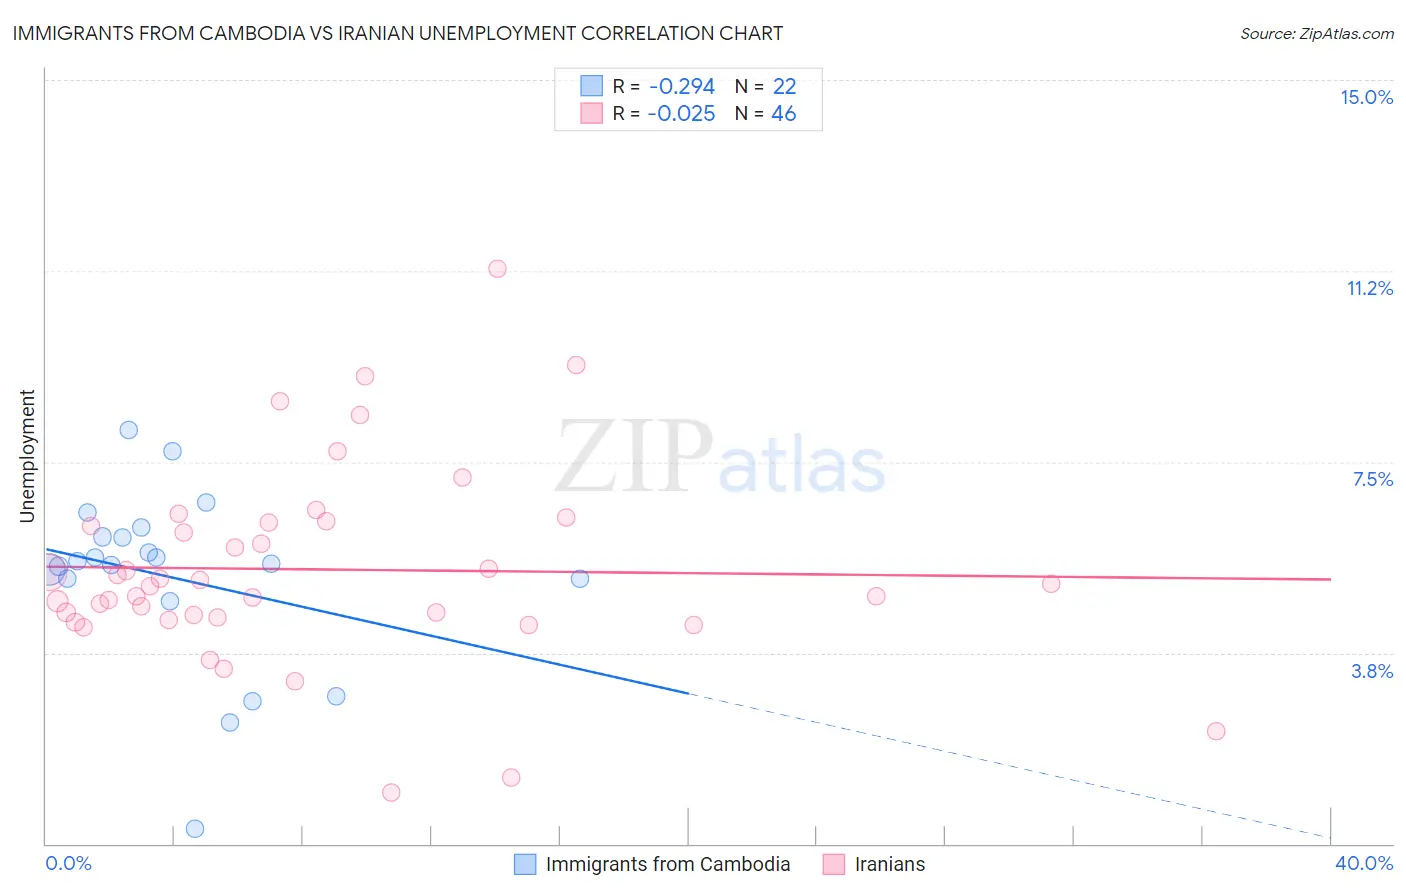
Immigrants from Cambodia vs Iranian Unemployment Correlation Chart
The statistical analysis conducted on geographies consisting of 205,100,731 people shows a weak negative correlation between the proportion of Immigrants from Cambodia and unemployment in the United States with a correlation coefficient (R) of -0.294 and weighted average of 5.5%. Similarly, the statistical analysis conducted on geographies consisting of 316,755,420 people shows no correlation between the proportion of Iranians and unemployment in the United States with a correlation coefficient (R) of -0.025 and weighted average of 5.1%, a difference of 8.3%.
Unemployment Correlation Summary
| Measurement | Immigrants from Cambodia | Iranian |
| Minimum | 0.30% | 1.0% |
| Maximum | 8.1% | 11.3% |
| Range | 7.8% | 10.3% |
| Mean | 5.2% | 5.4% |
| Median | 5.5% | 5.1% |
| Interquartile 25% (IQ1) | 5.2% | 4.4% |
| Interquartile 75% (IQ3) | 6.0% | 6.3% |
| Interquartile Range (IQR) | 0.83% | 1.9% |
| Standard Deviation (Sample) | 1.8% | 1.9% |
| Standard Deviation (Population) | 1.7% | 1.9% |
Similar Demographics by Unemployment
Demographics Similar to Immigrants from Cambodia by Unemployment
In terms of unemployment, the demographic groups most similar to Immigrants from Cambodia are Immigrants from Panama (5.5%, a difference of 0.030%), Moroccan (5.5%, a difference of 0.060%), Immigrants from Western Asia (5.5%, a difference of 0.27%), Immigrants (5.5%, a difference of 0.36%), and Cree (5.6%, a difference of 0.37%).
| Demographics | Rating | Rank | Unemployment |
| Hawaiians | 5.4 /100 | #229 | Tragic 5.5% |
| Ottawa | 5.4 /100 | #230 | Tragic 5.5% |
| Immigrants | Africa | 4.9 /100 | #231 | Tragic 5.5% |
| Comanche | 4.9 /100 | #232 | Tragic 5.5% |
| Immigrants | Syria | 4.8 /100 | #233 | Tragic 5.5% |
| Panamanians | 4.7 /100 | #234 | Tragic 5.5% |
| Immigrants | Panama | 3.4 /100 | #235 | Tragic 5.5% |
| Immigrants | Cambodia | 3.3 /100 | #236 | Tragic 5.5% |
| Moroccans | 3.2 /100 | #237 | Tragic 5.5% |
| Immigrants | Western Asia | 2.8 /100 | #238 | Tragic 5.5% |
| Immigrants | Immigrants | 2.6 /100 | #239 | Tragic 5.5% |
| Cree | 2.6 /100 | #240 | Tragic 5.6% |
| Tlingit-Haida | 2.0 /100 | #241 | Tragic 5.6% |
| Spanish Americans | 2.0 /100 | #242 | Tragic 5.6% |
| Marshallese | 1.3 /100 | #243 | Tragic 5.6% |
Demographics Similar to Iranians by Unemployment
In terms of unemployment, the demographic groups most similar to Iranians are Immigrants from Croatia (5.1%, a difference of 0.030%), Immigrants from Ethiopia (5.1%, a difference of 0.030%), Immigrants from Jordan (5.1%, a difference of 0.040%), Immigrants from Europe (5.1%, a difference of 0.090%), and Immigrants from Burma/Myanmar (5.1%, a difference of 0.090%).
| Demographics | Rating | Rank | Unemployment |
| Asians | 89.0 /100 | #123 | Excellent 5.1% |
| Ethiopians | 88.6 /100 | #124 | Excellent 5.1% |
| Immigrants | Eastern Asia | 88.3 /100 | #125 | Excellent 5.1% |
| Kenyans | 88.2 /100 | #126 | Excellent 5.1% |
| Immigrants | Kenya | 88.2 /100 | #127 | Excellent 5.1% |
| Immigrants | Eastern Africa | 88.1 /100 | #128 | Excellent 5.1% |
| Immigrants | Latvia | 88.0 /100 | #129 | Excellent 5.1% |
| Iranians | 86.9 /100 | #130 | Excellent 5.1% |
| Immigrants | Croatia | 86.8 /100 | #131 | Excellent 5.1% |
| Immigrants | Ethiopia | 86.7 /100 | #132 | Excellent 5.1% |
| Immigrants | Jordan | 86.6 /100 | #133 | Excellent 5.1% |
| Immigrants | Europe | 86.3 /100 | #134 | Excellent 5.1% |
| Immigrants | Burma/Myanmar | 86.2 /100 | #135 | Excellent 5.1% |
| Immigrants | Spain | 86.2 /100 | #136 | Excellent 5.1% |
| Immigrants | Saudi Arabia | 85.6 /100 | #137 | Excellent 5.1% |