Vietnamese vs Iranian Unemployment
COMPARE
Vietnamese
Iranian
Unemployment
Unemployment Comparison
Vietnamese
Iranians
6.5%
UNEMPLOYMENT
0.0/ 100
METRIC RATING
309th/ 347
METRIC RANK
5.1%
UNEMPLOYMENT
86.9/ 100
METRIC RATING
130th/ 347
METRIC RANK
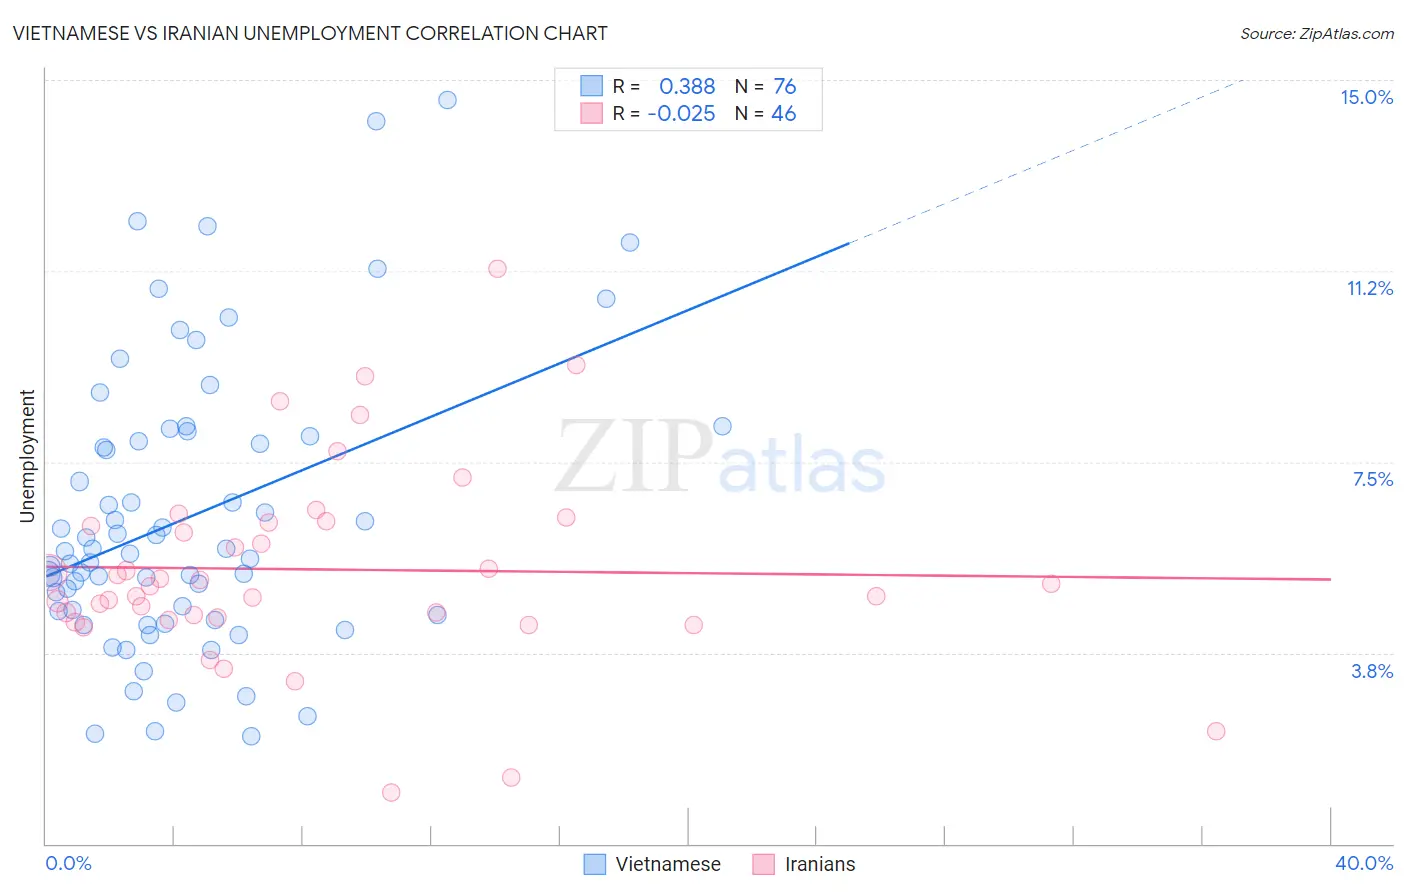
Vietnamese vs Iranian Unemployment Correlation Chart
The statistical analysis conducted on geographies consisting of 170,737,868 people shows a mild positive correlation between the proportion of Vietnamese and unemployment in the United States with a correlation coefficient (R) of 0.388 and weighted average of 6.5%. Similarly, the statistical analysis conducted on geographies consisting of 316,755,420 people shows no correlation between the proportion of Iranians and unemployment in the United States with a correlation coefficient (R) of -0.025 and weighted average of 5.1%, a difference of 27.2%.
Unemployment Correlation Summary
| Measurement | Vietnamese | Iranian |
| Minimum | 2.1% | 1.0% |
| Maximum | 14.6% | 11.3% |
| Range | 12.5% | 10.3% |
| Mean | 6.4% | 5.4% |
| Median | 5.7% | 5.1% |
| Interquartile 25% (IQ1) | 4.5% | 4.4% |
| Interquartile 75% (IQ3) | 8.0% | 6.3% |
| Interquartile Range (IQR) | 3.4% | 1.9% |
| Standard Deviation (Sample) | 2.8% | 1.9% |
| Standard Deviation (Population) | 2.8% | 1.9% |
Similar Demographics by Unemployment
Demographics Similar to Vietnamese by Unemployment
In terms of unemployment, the demographic groups most similar to Vietnamese are Barbadian (6.5%, a difference of 0.010%), Immigrants from Belize (6.5%, a difference of 0.27%), Immigrants from Bangladesh (6.5%, a difference of 0.38%), Cape Verdean (6.5%, a difference of 0.60%), and Lumbee (6.4%, a difference of 0.87%).
| Demographics | Rating | Rank | Unemployment |
| West Indians | 0.0 /100 | #302 | Tragic 6.4% |
| Belizeans | 0.0 /100 | #303 | Tragic 6.4% |
| Immigrants | Jamaica | 0.0 /100 | #304 | Tragic 6.4% |
| Menominee | 0.0 /100 | #305 | Tragic 6.4% |
| Lumbee | 0.0 /100 | #306 | Tragic 6.4% |
| Immigrants | Bangladesh | 0.0 /100 | #307 | Tragic 6.5% |
| Barbadians | 0.0 /100 | #308 | Tragic 6.5% |
| Vietnamese | 0.0 /100 | #309 | Tragic 6.5% |
| Immigrants | Belize | 0.0 /100 | #310 | Tragic 6.5% |
| Cape Verdeans | 0.0 /100 | #311 | Tragic 6.5% |
| Colville | 0.0 /100 | #312 | Tragic 6.6% |
| Immigrants | Barbados | 0.0 /100 | #313 | Tragic 6.6% |
| Blacks/African Americans | 0.0 /100 | #314 | Tragic 6.6% |
| Houma | 0.0 /100 | #315 | Tragic 6.7% |
| Immigrants | Dominica | 0.0 /100 | #316 | Tragic 6.7% |
Demographics Similar to Iranians by Unemployment
In terms of unemployment, the demographic groups most similar to Iranians are Immigrants from Croatia (5.1%, a difference of 0.030%), Immigrants from Ethiopia (5.1%, a difference of 0.030%), Immigrants from Jordan (5.1%, a difference of 0.040%), Immigrants from Europe (5.1%, a difference of 0.090%), and Immigrants from Burma/Myanmar (5.1%, a difference of 0.090%).
| Demographics | Rating | Rank | Unemployment |
| Asians | 89.0 /100 | #123 | Excellent 5.1% |
| Ethiopians | 88.6 /100 | #124 | Excellent 5.1% |
| Immigrants | Eastern Asia | 88.3 /100 | #125 | Excellent 5.1% |
| Kenyans | 88.2 /100 | #126 | Excellent 5.1% |
| Immigrants | Kenya | 88.2 /100 | #127 | Excellent 5.1% |
| Immigrants | Eastern Africa | 88.1 /100 | #128 | Excellent 5.1% |
| Immigrants | Latvia | 88.0 /100 | #129 | Excellent 5.1% |
| Iranians | 86.9 /100 | #130 | Excellent 5.1% |
| Immigrants | Croatia | 86.8 /100 | #131 | Excellent 5.1% |
| Immigrants | Ethiopia | 86.7 /100 | #132 | Excellent 5.1% |
| Immigrants | Jordan | 86.6 /100 | #133 | Excellent 5.1% |
| Immigrants | Europe | 86.3 /100 | #134 | Excellent 5.1% |
| Immigrants | Burma/Myanmar | 86.2 /100 | #135 | Excellent 5.1% |
| Immigrants | Spain | 86.2 /100 | #136 | Excellent 5.1% |
| Immigrants | Saudi Arabia | 85.6 /100 | #137 | Excellent 5.1% |