Immigrants from Western Europe vs Creek College, Under 1 year
COMPARE
Immigrants from Western Europe
Creek
College, Under 1 year
College, Under 1 year Comparison
Immigrants from Western Europe
Creek
68.5%
COLLEGE, UNDER 1 YEAR
98.6/ 100
METRIC RATING
75th/ 347
METRIC RANK
59.3%
COLLEGE, UNDER 1 YEAR
0.0/ 100
METRIC RATING
291st/ 347
METRIC RANK
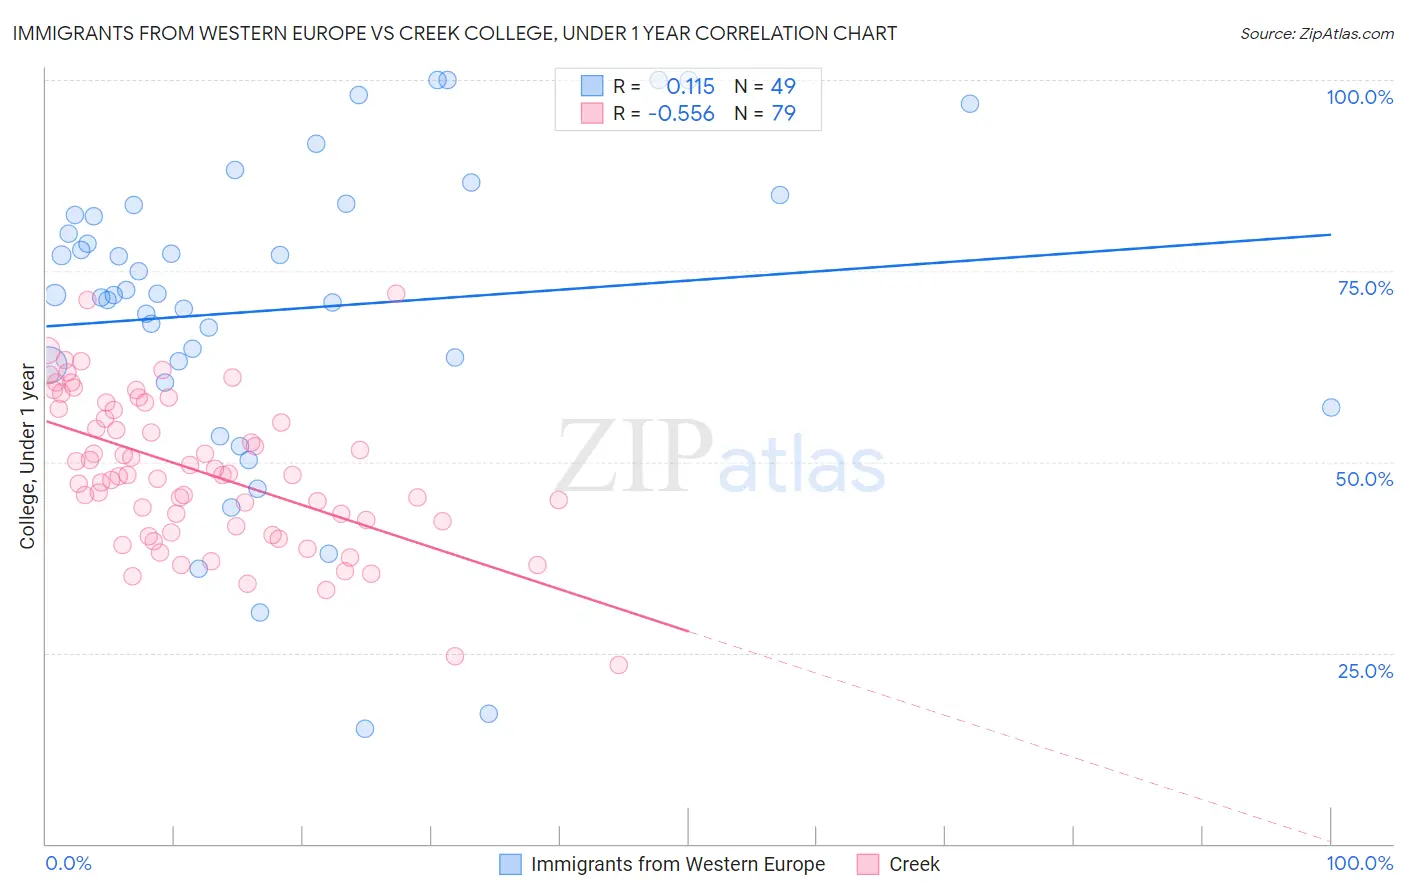
Immigrants from Western Europe vs Creek College, Under 1 year Correlation Chart
The statistical analysis conducted on geographies consisting of 494,076,682 people shows a poor positive correlation between the proportion of Immigrants from Western Europe and percentage of population with at least college, under 1 year education in the United States with a correlation coefficient (R) of 0.115 and weighted average of 68.5%. Similarly, the statistical analysis conducted on geographies consisting of 178,480,346 people shows a substantial negative correlation between the proportion of Creek and percentage of population with at least college, under 1 year education in the United States with a correlation coefficient (R) of -0.556 and weighted average of 59.3%, a difference of 15.6%.
College, Under 1 year Correlation Summary
| Measurement | Immigrants from Western Europe | Creek |
| Minimum | 15.0% | 23.4% |
| Maximum | 100.0% | 72.1% |
| Range | 85.0% | 48.7% |
| Mean | 70.0% | 48.8% |
| Median | 71.9% | 48.2% |
| Interquartile 25% (IQ1) | 61.5% | 41.6% |
| Interquartile 75% (IQ3) | 82.9% | 57.0% |
| Interquartile Range (IQR) | 21.4% | 15.4% |
| Standard Deviation (Sample) | 20.3% | 9.9% |
| Standard Deviation (Population) | 20.1% | 9.8% |
Similar Demographics by College, Under 1 year
Demographics Similar to Immigrants from Western Europe by College, Under 1 year
In terms of college, under 1 year, the demographic groups most similar to Immigrants from Western Europe are Laotian (68.5%, a difference of 0.0%), British (68.5%, a difference of 0.040%), Danish (68.5%, a difference of 0.060%), Greek (68.5%, a difference of 0.070%), and Immigrants from Spain (68.4%, a difference of 0.090%).
| Demographics | Rating | Rank | College, Under 1 year |
| Immigrants | Indonesia | 99.2 /100 | #68 | Exceptional 68.9% |
| Immigrants | Romania | 99.2 /100 | #69 | Exceptional 68.9% |
| Lithuanians | 99.1 /100 | #70 | Exceptional 68.8% |
| Immigrants | Europe | 99.1 /100 | #71 | Exceptional 68.8% |
| Bolivians | 99.0 /100 | #72 | Exceptional 68.7% |
| Immigrants | England | 99.0 /100 | #73 | Exceptional 68.7% |
| Swedes | 98.9 /100 | #74 | Exceptional 68.7% |
| Immigrants | Western Europe | 98.6 /100 | #75 | Exceptional 68.5% |
| Laotians | 98.6 /100 | #76 | Exceptional 68.5% |
| British | 98.6 /100 | #77 | Exceptional 68.5% |
| Danes | 98.6 /100 | #78 | Exceptional 68.5% |
| Greeks | 98.6 /100 | #79 | Exceptional 68.5% |
| Immigrants | Spain | 98.5 /100 | #80 | Exceptional 68.4% |
| Immigrants | Greece | 98.5 /100 | #81 | Exceptional 68.4% |
| Norwegians | 98.4 /100 | #82 | Exceptional 68.4% |
Demographics Similar to Creek by College, Under 1 year
In terms of college, under 1 year, the demographic groups most similar to Creek are Nicaraguan (59.2%, a difference of 0.040%), Ecuadorian (59.3%, a difference of 0.090%), Choctaw (59.3%, a difference of 0.13%), Black/African American (59.4%, a difference of 0.20%), and Seminole (59.1%, a difference of 0.23%).
| Demographics | Rating | Rank | College, Under 1 year |
| Immigrants | St. Vincent and the Grenadines | 0.0 /100 | #284 | Tragic 59.6% |
| Paiute | 0.0 /100 | #285 | Tragic 59.6% |
| British West Indians | 0.0 /100 | #286 | Tragic 59.5% |
| Sioux | 0.0 /100 | #287 | Tragic 59.4% |
| Blacks/African Americans | 0.0 /100 | #288 | Tragic 59.4% |
| Choctaw | 0.0 /100 | #289 | Tragic 59.3% |
| Ecuadorians | 0.0 /100 | #290 | Tragic 59.3% |
| Creek | 0.0 /100 | #291 | Tragic 59.3% |
| Nicaraguans | 0.0 /100 | #292 | Tragic 59.2% |
| Seminole | 0.0 /100 | #293 | Tragic 59.1% |
| Immigrants | Belize | 0.0 /100 | #294 | Tragic 59.1% |
| Immigrants | Grenada | 0.0 /100 | #295 | Tragic 59.1% |
| Central American Indians | 0.0 /100 | #296 | Tragic 59.0% |
| Guyanese | 0.0 /100 | #297 | Tragic 59.0% |
| Immigrants | Ecuador | 0.0 /100 | #298 | Tragic 58.7% |