Salvadoran vs Creek Unemployment
COMPARE
Salvadoran
Creek
Unemployment
Unemployment Comparison
Salvadorans
Creek
5.8%
UNEMPLOYMENT
0.1/ 100
METRIC RATING
263rd/ 347
METRIC RANK
5.4%
UNEMPLOYMENT
19.4/ 100
METRIC RATING
207th/ 347
METRIC RANK
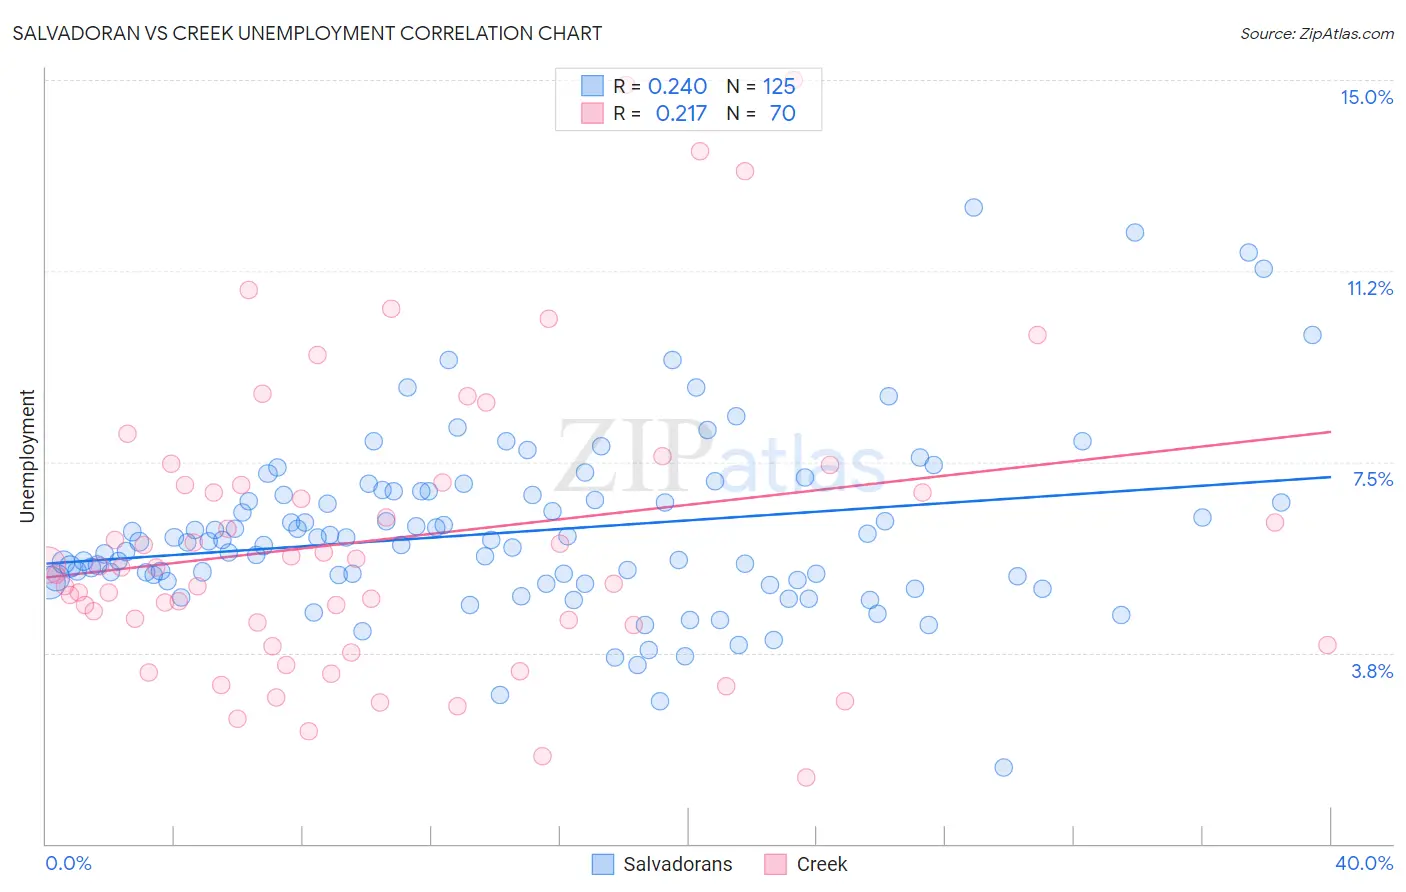
Salvadoran vs Creek Unemployment Correlation Chart
The statistical analysis conducted on geographies consisting of 398,590,772 people shows a weak positive correlation between the proportion of Salvadorans and unemployment in the United States with a correlation coefficient (R) of 0.240 and weighted average of 5.8%. Similarly, the statistical analysis conducted on geographies consisting of 178,280,208 people shows a weak positive correlation between the proportion of Creek and unemployment in the United States with a correlation coefficient (R) of 0.217 and weighted average of 5.4%, a difference of 8.0%.
Unemployment Correlation Summary
| Measurement | Salvadoran | Creek |
| Minimum | 1.5% | 1.3% |
| Maximum | 12.5% | 15.0% |
| Range | 11.0% | 13.7% |
| Mean | 6.1% | 6.0% |
| Median | 5.9% | 5.4% |
| Interquartile 25% (IQ1) | 5.2% | 4.3% |
| Interquartile 75% (IQ3) | 6.9% | 7.1% |
| Interquartile Range (IQR) | 1.7% | 2.8% |
| Standard Deviation (Sample) | 1.7% | 2.9% |
| Standard Deviation (Population) | 1.7% | 2.9% |
Similar Demographics by Unemployment
Demographics Similar to Salvadorans by Unemployment
In terms of unemployment, the demographic groups most similar to Salvadorans are Sierra Leonean (5.8%, a difference of 0.030%), Immigrants from Liberia (5.8%, a difference of 0.090%), Immigrants from Guatemala (5.8%, a difference of 0.13%), Immigrants from Uzbekistan (5.8%, a difference of 0.15%), and Nigerian (5.8%, a difference of 0.16%).
| Demographics | Rating | Rank | Unemployment |
| Guatemalans | 0.2 /100 | #256 | Tragic 5.8% |
| Yaqui | 0.2 /100 | #257 | Tragic 5.8% |
| Immigrants | Bahamas | 0.1 /100 | #258 | Tragic 5.8% |
| Sub-Saharan Africans | 0.1 /100 | #259 | Tragic 5.8% |
| Immigrants | Uzbekistan | 0.1 /100 | #260 | Tragic 5.8% |
| Immigrants | Guatemala | 0.1 /100 | #261 | Tragic 5.8% |
| Sierra Leoneans | 0.1 /100 | #262 | Tragic 5.8% |
| Salvadorans | 0.1 /100 | #263 | Tragic 5.8% |
| Immigrants | Liberia | 0.1 /100 | #264 | Tragic 5.8% |
| Nigerians | 0.1 /100 | #265 | Tragic 5.8% |
| Mexican American Indians | 0.1 /100 | #266 | Tragic 5.8% |
| Immigrants | Nigeria | 0.1 /100 | #267 | Tragic 5.8% |
| Immigrants | Sierra Leone | 0.1 /100 | #268 | Tragic 5.8% |
| Immigrants | El Salvador | 0.1 /100 | #269 | Tragic 5.8% |
| Blackfeet | 0.1 /100 | #270 | Tragic 5.8% |
Demographics Similar to Creek by Unemployment
In terms of unemployment, the demographic groups most similar to Creek are Portuguese (5.4%, a difference of 0.030%), Immigrants from Iran (5.4%, a difference of 0.060%), Immigrants from Iraq (5.4%, a difference of 0.080%), Iraqi (5.4%, a difference of 0.13%), and Ugandan (5.4%, a difference of 0.14%).
| Demographics | Rating | Rank | Unemployment |
| Koreans | 27.4 /100 | #200 | Fair 5.3% |
| Immigrants | South Eastern Asia | 27.0 /100 | #201 | Fair 5.3% |
| Cherokee | 25.5 /100 | #202 | Fair 5.3% |
| Immigrants | Micronesia | 25.2 /100 | #203 | Fair 5.3% |
| Immigrants | Ukraine | 24.9 /100 | #204 | Fair 5.3% |
| Native Hawaiians | 24.1 /100 | #205 | Fair 5.3% |
| Immigrants | Peru | 22.7 /100 | #206 | Fair 5.4% |
| Creek | 19.4 /100 | #207 | Poor 5.4% |
| Portuguese | 19.0 /100 | #208 | Poor 5.4% |
| Immigrants | Iran | 18.8 /100 | #209 | Poor 5.4% |
| Immigrants | Iraq | 18.6 /100 | #210 | Poor 5.4% |
| Iraqis | 18.1 /100 | #211 | Poor 5.4% |
| Ugandans | 18.0 /100 | #212 | Poor 5.4% |
| Immigrants | Middle Africa | 15.3 /100 | #213 | Poor 5.4% |
| Immigrants | Costa Rica | 15.2 /100 | #214 | Poor 5.4% |