Immigrants from Central America vs Brazilian Unemployment Among Women with Children Ages 6 to 17 years
COMPARE
Immigrants from Central America
Brazilian
Unemployment Among Women with Children Ages 6 to 17 years
Unemployment Among Women with Children Ages 6 to 17 years Comparison
Immigrants from Central America
Brazilians
9.5%
UNEMPLOYMENT AMONG WOMEN WITH CHILDREN AGES 6 TO 17 YEARS
0.6/ 100
METRIC RATING
259th/ 347
METRIC RANK
9.1%
UNEMPLOYMENT AMONG WOMEN WITH CHILDREN AGES 6 TO 17 YEARS
24.4/ 100
METRIC RATING
196th/ 347
METRIC RANK
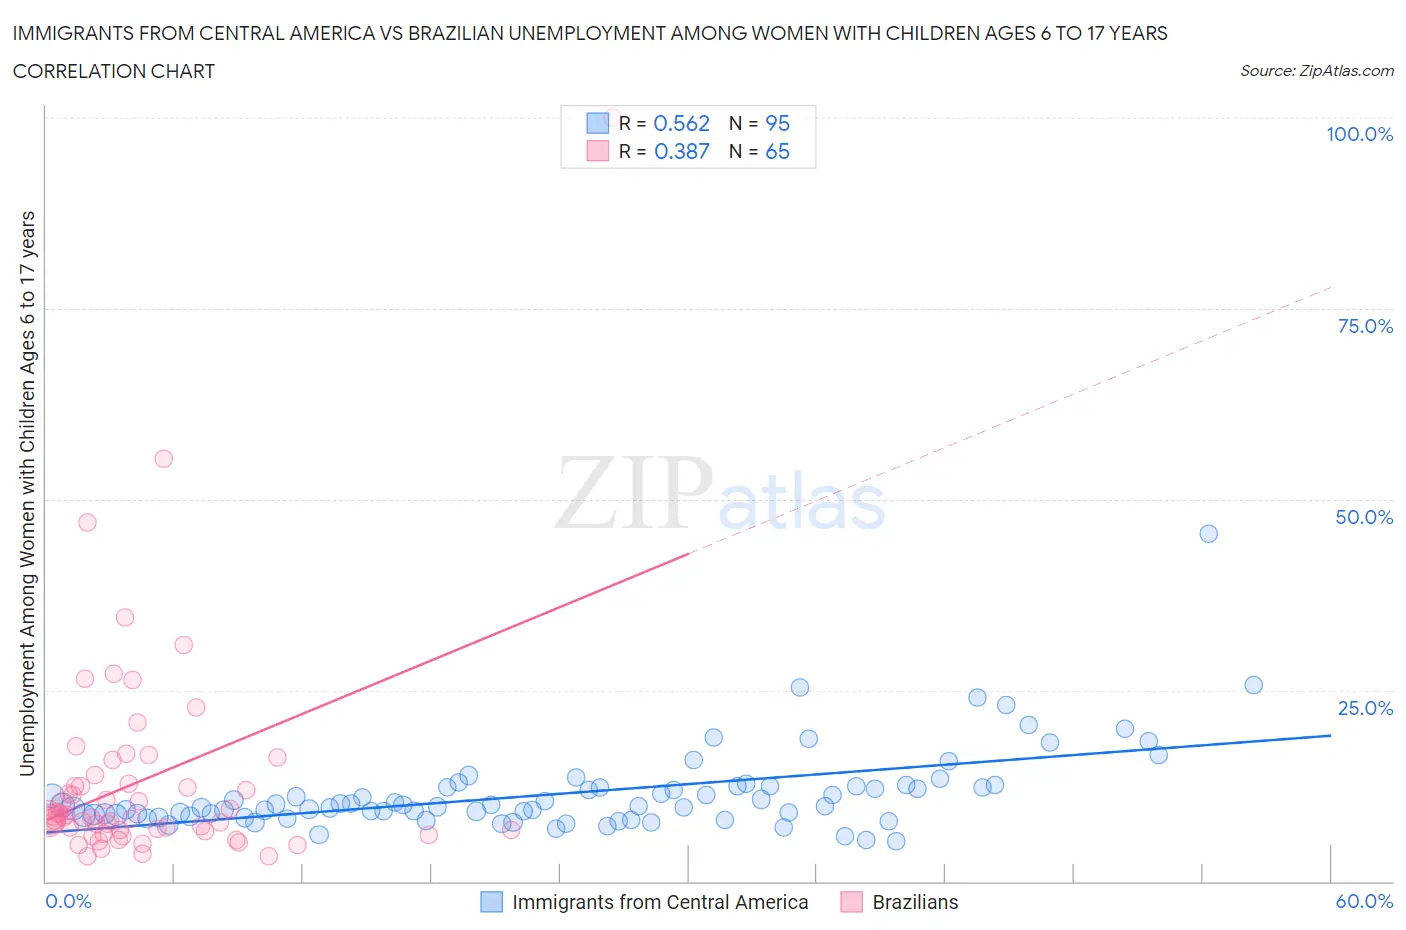
Immigrants from Central America vs Brazilian Unemployment Among Women with Children Ages 6 to 17 years Correlation Chart
The statistical analysis conducted on geographies consisting of 349,954,771 people shows a substantial positive correlation between the proportion of Immigrants from Central America and unemployment rate among women with children between the ages 6 and 17 in the United States with a correlation coefficient (R) of 0.562 and weighted average of 9.5%. Similarly, the statistical analysis conducted on geographies consisting of 240,779,171 people shows a mild positive correlation between the proportion of Brazilians and unemployment rate among women with children between the ages 6 and 17 in the United States with a correlation coefficient (R) of 0.387 and weighted average of 9.1%, a difference of 4.3%.
Unemployment Among Women with Children Ages 6 to 17 years Correlation Summary
| Measurement | Immigrants from Central America | Brazilian |
| Minimum | 5.2% | 3.3% |
| Maximum | 45.5% | 100.0% |
| Range | 40.3% | 96.7% |
| Mean | 11.5% | 13.3% |
| Median | 9.8% | 8.4% |
| Interquartile 25% (IQ1) | 8.6% | 6.7% |
| Interquartile 75% (IQ3) | 12.4% | 13.3% |
| Interquartile Range (IQR) | 3.8% | 6.7% |
| Standard Deviation (Sample) | 5.5% | 14.7% |
| Standard Deviation (Population) | 5.5% | 14.5% |
Similar Demographics by Unemployment Among Women with Children Ages 6 to 17 years
Demographics Similar to Immigrants from Central America by Unemployment Among Women with Children Ages 6 to 17 years
In terms of unemployment among women with children ages 6 to 17 years, the demographic groups most similar to Immigrants from Central America are Immigrants from Mexico (9.5%, a difference of 0.090%), Italian (9.5%, a difference of 0.11%), Celtic (9.5%, a difference of 0.18%), South American (9.5%, a difference of 0.19%), and Canadian (9.4%, a difference of 0.20%).
| Demographics | Rating | Rank | Unemployment Among Women with Children Ages 6 to 17 years |
| Creek | 1.2 /100 | #252 | Tragic 9.4% |
| Portuguese | 1.1 /100 | #253 | Tragic 9.4% |
| Nicaraguans | 1.0 /100 | #254 | Tragic 9.4% |
| Lithuanians | 0.9 /100 | #255 | Tragic 9.4% |
| Canadians | 0.8 /100 | #256 | Tragic 9.4% |
| Celtics | 0.7 /100 | #257 | Tragic 9.5% |
| Immigrants | Mexico | 0.7 /100 | #258 | Tragic 9.5% |
| Immigrants | Central America | 0.6 /100 | #259 | Tragic 9.5% |
| Italians | 0.6 /100 | #260 | Tragic 9.5% |
| South Americans | 0.5 /100 | #261 | Tragic 9.5% |
| Senegalese | 0.5 /100 | #262 | Tragic 9.5% |
| Lebanese | 0.5 /100 | #263 | Tragic 9.5% |
| Immigrants | Ghana | 0.4 /100 | #264 | Tragic 9.5% |
| West Indians | 0.4 /100 | #265 | Tragic 9.5% |
| Immigrants | Jamaica | 0.3 /100 | #266 | Tragic 9.5% |
Demographics Similar to Brazilians by Unemployment Among Women with Children Ages 6 to 17 years
In terms of unemployment among women with children ages 6 to 17 years, the demographic groups most similar to Brazilians are Immigrants from Panama (9.1%, a difference of 0.010%), Austrian (9.1%, a difference of 0.030%), Immigrants from Kazakhstan (9.1%, a difference of 0.050%), Immigrants from Turkey (9.1%, a difference of 0.080%), and Guamanian/Chamorro (9.1%, a difference of 0.16%).
| Demographics | Rating | Rank | Unemployment Among Women with Children Ages 6 to 17 years |
| Immigrants | Immigrants | 29.2 /100 | #189 | Fair 9.1% |
| Slovenes | 28.5 /100 | #190 | Fair 9.1% |
| Belizeans | 28.4 /100 | #191 | Fair 9.1% |
| Guamanians/Chamorros | 27.2 /100 | #192 | Fair 9.1% |
| Immigrants | Turkey | 25.8 /100 | #193 | Fair 9.1% |
| Immigrants | Kazakhstan | 25.3 /100 | #194 | Fair 9.1% |
| Austrians | 25.0 /100 | #195 | Fair 9.1% |
| Brazilians | 24.4 /100 | #196 | Fair 9.1% |
| Immigrants | Panama | 24.3 /100 | #197 | Fair 9.1% |
| Guyanese | 21.8 /100 | #198 | Fair 9.1% |
| Czechoslovakians | 20.8 /100 | #199 | Fair 9.1% |
| Trinidadians and Tobagonians | 18.2 /100 | #200 | Poor 9.1% |
| Immigrants | Trinidad and Tobago | 16.7 /100 | #201 | Poor 9.1% |
| Immigrants | Middle Africa | 15.6 /100 | #202 | Poor 9.1% |
| Maltese | 15.3 /100 | #203 | Poor 9.1% |