Immigrants from Latvia vs Assyrian/Chaldean/Syriac Male Unemployment
COMPARE
Immigrants from Latvia
Assyrian/Chaldean/Syriac
Male Unemployment
Male Unemployment Comparison
Immigrants from Latvia
Assyrians/Chaldeans/Syriacs
5.1%
MALE UNEMPLOYMENT
87.5/ 100
METRIC RATING
124th/ 347
METRIC RANK
5.0%
MALE UNEMPLOYMENT
96.9/ 100
METRIC RATING
75th/ 347
METRIC RANK
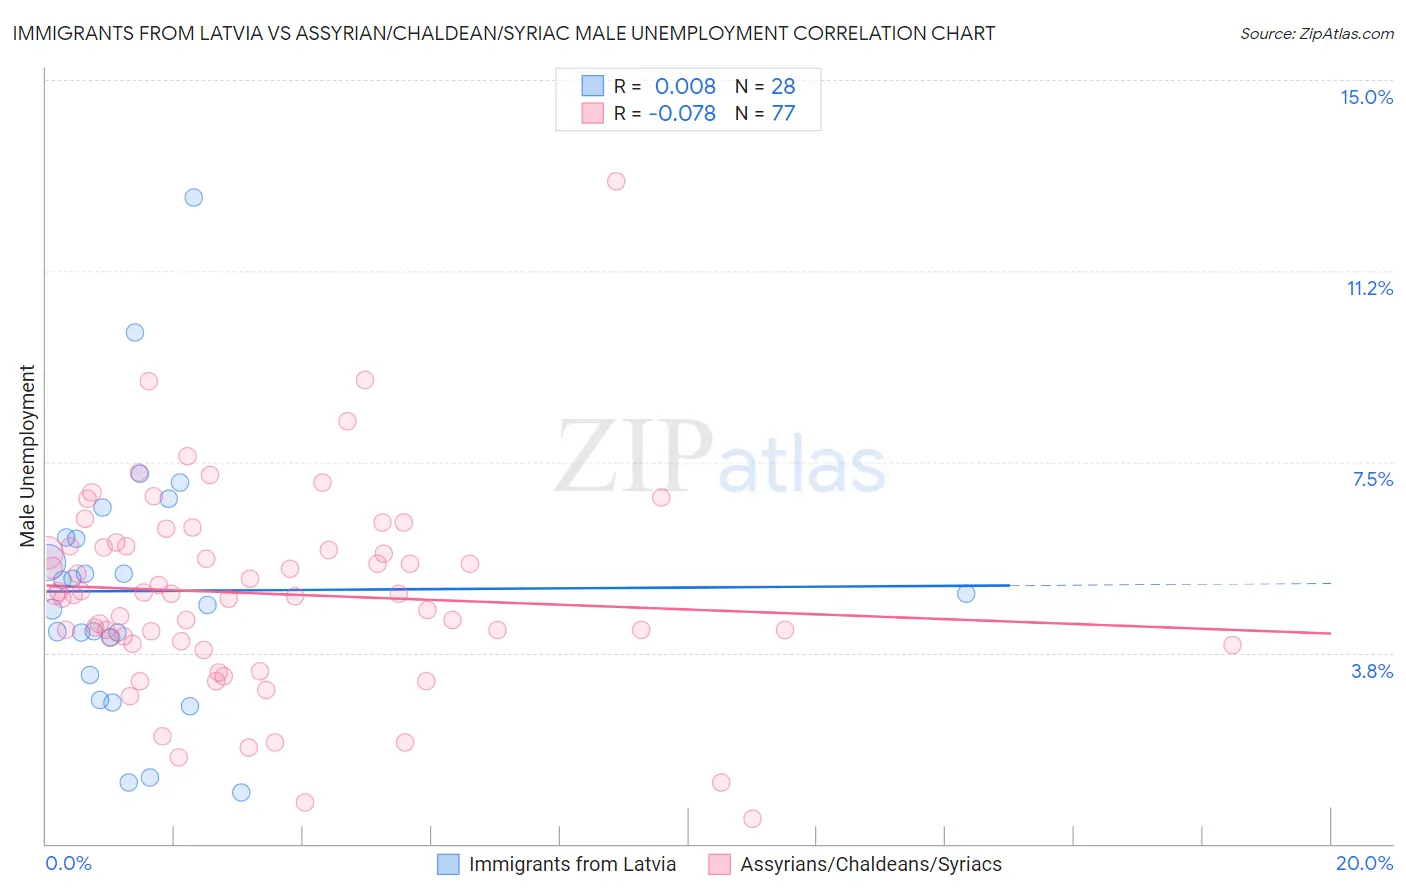
Immigrants from Latvia vs Assyrian/Chaldean/Syriac Male Unemployment Correlation Chart
The statistical analysis conducted on geographies consisting of 113,659,649 people shows no correlation between the proportion of Immigrants from Latvia and unemployment rate among males in the United States with a correlation coefficient (R) of 0.008 and weighted average of 5.1%. Similarly, the statistical analysis conducted on geographies consisting of 110,205,366 people shows a slight negative correlation between the proportion of Assyrians/Chaldeans/Syriacs and unemployment rate among males in the United States with a correlation coefficient (R) of -0.078 and weighted average of 5.0%, a difference of 2.3%.
Male Unemployment Correlation Summary
| Measurement | Immigrants from Latvia | Assyrian/Chaldean/Syriac |
| Minimum | 1.0% | 0.50% |
| Maximum | 12.7% | 13.0% |
| Range | 11.7% | 12.5% |
| Mean | 5.0% | 4.9% |
| Median | 4.8% | 4.9% |
| Interquartile 25% (IQ1) | 3.7% | 3.9% |
| Interquartile 75% (IQ3) | 6.0% | 5.8% |
| Interquartile Range (IQR) | 2.3% | 1.9% |
| Standard Deviation (Sample) | 2.5% | 2.0% |
| Standard Deviation (Population) | 2.5% | 2.0% |
Similar Demographics by Male Unemployment
Demographics Similar to Immigrants from Latvia by Male Unemployment
In terms of male unemployment, the demographic groups most similar to Immigrants from Latvia are Palestinian (5.1%, a difference of 0.030%), Immigrants from Lithuania (5.1%, a difference of 0.040%), Nicaraguan (5.1%, a difference of 0.10%), Immigrants from Colombia (5.1%, a difference of 0.10%), and Ukrainian (5.1%, a difference of 0.13%).
| Demographics | Rating | Rank | Male Unemployment |
| Estonians | 89.0 /100 | #117 | Excellent 5.1% |
| Cypriots | 88.8 /100 | #118 | Excellent 5.1% |
| French Canadians | 88.6 /100 | #119 | Excellent 5.1% |
| Ukrainians | 88.4 /100 | #120 | Excellent 5.1% |
| Mongolians | 88.4 /100 | #121 | Excellent 5.1% |
| Nicaraguans | 88.2 /100 | #122 | Excellent 5.1% |
| Palestinians | 87.7 /100 | #123 | Excellent 5.1% |
| Immigrants | Latvia | 87.5 /100 | #124 | Excellent 5.1% |
| Immigrants | Lithuania | 87.2 /100 | #125 | Excellent 5.1% |
| Immigrants | Colombia | 86.8 /100 | #126 | Excellent 5.1% |
| Immigrants | Brazil | 86.3 /100 | #127 | Excellent 5.2% |
| Hungarians | 85.1 /100 | #128 | Excellent 5.2% |
| Immigrants | Western Europe | 84.8 /100 | #129 | Excellent 5.2% |
| Immigrants | Malaysia | 83.5 /100 | #130 | Excellent 5.2% |
| Immigrants | Germany | 83.0 /100 | #131 | Excellent 5.2% |
Demographics Similar to Assyrians/Chaldeans/Syriacs by Male Unemployment
In terms of male unemployment, the demographic groups most similar to Assyrians/Chaldeans/Syriacs are Immigrants from North America (5.0%, a difference of 0.030%), Greek (5.0%, a difference of 0.060%), Immigrants from South Africa (5.0%, a difference of 0.14%), Immigrants from Sudan (5.0%, a difference of 0.16%), and Iranian (5.0%, a difference of 0.21%).
| Demographics | Rating | Rank | Male Unemployment |
| Australians | 97.4 /100 | #68 | Exceptional 5.0% |
| Immigrants | Sweden | 97.4 /100 | #69 | Exceptional 5.0% |
| Whites/Caucasians | 97.3 /100 | #70 | Exceptional 5.0% |
| New Zealanders | 97.3 /100 | #71 | Exceptional 5.0% |
| Immigrants | South Africa | 97.1 /100 | #72 | Exceptional 5.0% |
| Greeks | 97.0 /100 | #73 | Exceptional 5.0% |
| Immigrants | North America | 96.9 /100 | #74 | Exceptional 5.0% |
| Assyrians/Chaldeans/Syriacs | 96.9 /100 | #75 | Exceptional 5.0% |
| Immigrants | Sudan | 96.5 /100 | #76 | Exceptional 5.0% |
| Iranians | 96.4 /100 | #77 | Exceptional 5.0% |
| Immigrants | Northern Europe | 96.4 /100 | #78 | Exceptional 5.0% |
| South Africans | 96.4 /100 | #79 | Exceptional 5.0% |
| Argentineans | 96.2 /100 | #80 | Exceptional 5.0% |
| French | 96.2 /100 | #81 | Exceptional 5.0% |
| Chileans | 96.2 /100 | #82 | Exceptional 5.0% |