Nepalese vs Assyrian/Chaldean/Syriac Male Unemployment
COMPARE
Nepalese
Assyrian/Chaldean/Syriac
Male Unemployment
Male Unemployment Comparison
Nepalese
Assyrians/Chaldeans/Syriacs
6.4%
MALE UNEMPLOYMENT
0.0/ 100
METRIC RATING
292nd/ 347
METRIC RANK
5.0%
MALE UNEMPLOYMENT
96.9/ 100
METRIC RATING
75th/ 347
METRIC RANK
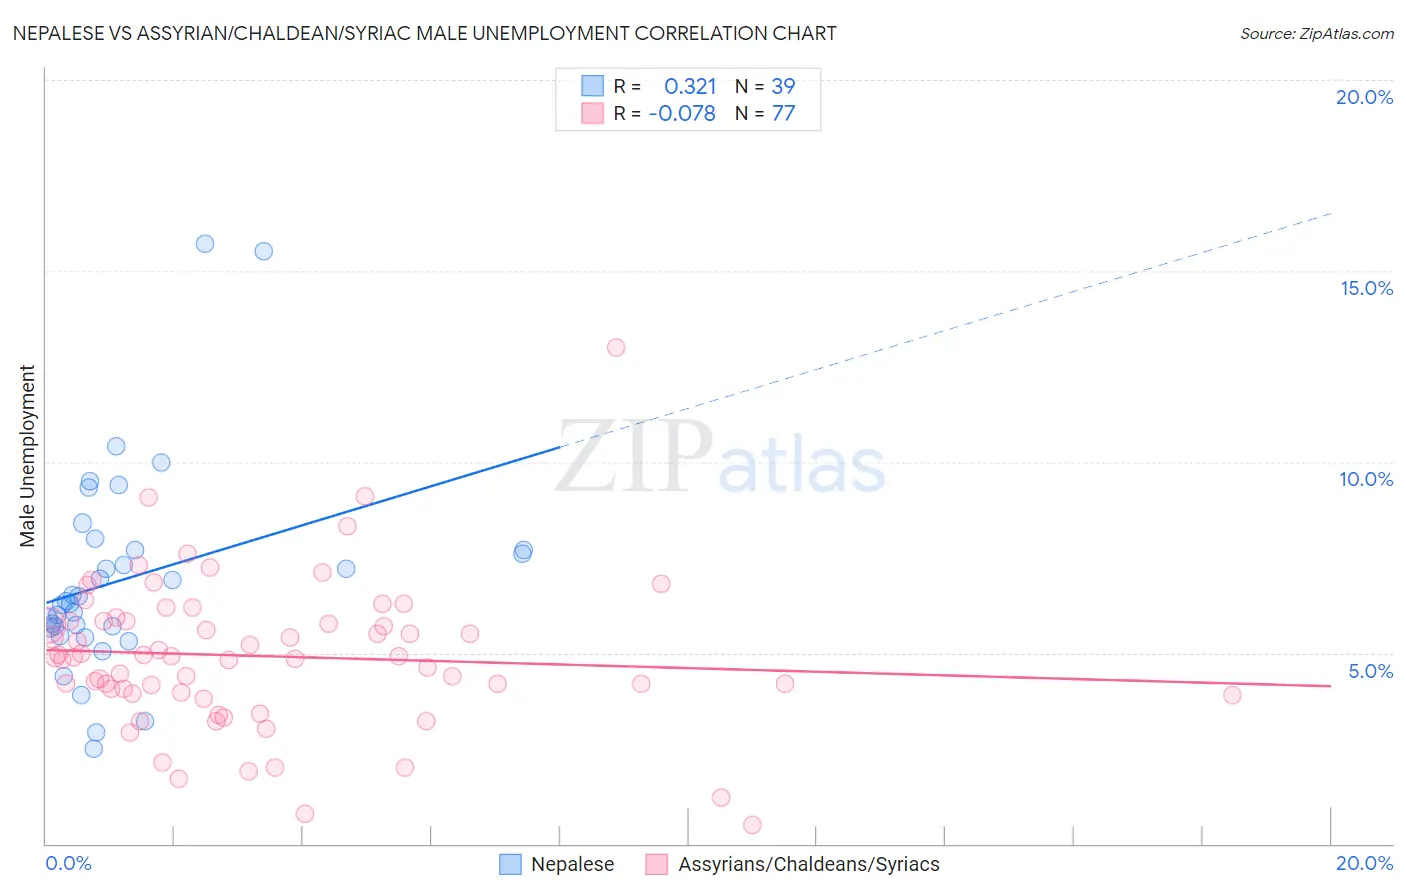
Nepalese vs Assyrian/Chaldean/Syriac Male Unemployment Correlation Chart
The statistical analysis conducted on geographies consisting of 24,511,248 people shows a mild positive correlation between the proportion of Nepalese and unemployment rate among males in the United States with a correlation coefficient (R) of 0.321 and weighted average of 6.4%. Similarly, the statistical analysis conducted on geographies consisting of 110,205,366 people shows a slight negative correlation between the proportion of Assyrians/Chaldeans/Syriacs and unemployment rate among males in the United States with a correlation coefficient (R) of -0.078 and weighted average of 5.0%, a difference of 28.0%.
Male Unemployment Correlation Summary
| Measurement | Nepalese | Assyrian/Chaldean/Syriac |
| Minimum | 2.5% | 0.50% |
| Maximum | 15.7% | 13.0% |
| Range | 13.2% | 12.5% |
| Mean | 7.0% | 4.9% |
| Median | 6.3% | 4.9% |
| Interquartile 25% (IQ1) | 5.7% | 3.9% |
| Interquartile 75% (IQ3) | 7.7% | 5.8% |
| Interquartile Range (IQR) | 2.0% | 1.9% |
| Standard Deviation (Sample) | 2.7% | 2.0% |
| Standard Deviation (Population) | 2.7% | 2.0% |
Similar Demographics by Male Unemployment
Demographics Similar to Nepalese by Male Unemployment
In terms of male unemployment, the demographic groups most similar to Nepalese are Haitian (6.4%, a difference of 0.030%), Senegalese (6.4%, a difference of 0.14%), Immigrants from the Azores (6.4%, a difference of 0.34%), U.S. Virgin Islander (6.4%, a difference of 0.87%), and Belizean (6.5%, a difference of 0.99%).
| Demographics | Rating | Rank | Male Unemployment |
| Immigrants | Ecuador | 0.0 /100 | #285 | Tragic 6.2% |
| Africans | 0.0 /100 | #286 | Tragic 6.3% |
| Central American Indians | 0.0 /100 | #287 | Tragic 6.3% |
| Immigrants | Senegal | 0.0 /100 | #288 | Tragic 6.3% |
| Immigrants | Caribbean | 0.0 /100 | #289 | Tragic 6.3% |
| U.S. Virgin Islanders | 0.0 /100 | #290 | Tragic 6.4% |
| Immigrants | Azores | 0.0 /100 | #291 | Tragic 6.4% |
| Nepalese | 0.0 /100 | #292 | Tragic 6.4% |
| Haitians | 0.0 /100 | #293 | Tragic 6.4% |
| Senegalese | 0.0 /100 | #294 | Tragic 6.4% |
| Belizeans | 0.0 /100 | #295 | Tragic 6.5% |
| Immigrants | Haiti | 0.0 /100 | #296 | Tragic 6.5% |
| Chippewa | 0.0 /100 | #297 | Tragic 6.6% |
| Jamaicans | 0.0 /100 | #298 | Tragic 6.6% |
| Immigrants | Bangladesh | 0.0 /100 | #299 | Tragic 6.6% |
Demographics Similar to Assyrians/Chaldeans/Syriacs by Male Unemployment
In terms of male unemployment, the demographic groups most similar to Assyrians/Chaldeans/Syriacs are Immigrants from North America (5.0%, a difference of 0.030%), Greek (5.0%, a difference of 0.060%), Immigrants from South Africa (5.0%, a difference of 0.14%), Immigrants from Sudan (5.0%, a difference of 0.16%), and Iranian (5.0%, a difference of 0.21%).
| Demographics | Rating | Rank | Male Unemployment |
| Australians | 97.4 /100 | #68 | Exceptional 5.0% |
| Immigrants | Sweden | 97.4 /100 | #69 | Exceptional 5.0% |
| Whites/Caucasians | 97.3 /100 | #70 | Exceptional 5.0% |
| New Zealanders | 97.3 /100 | #71 | Exceptional 5.0% |
| Immigrants | South Africa | 97.1 /100 | #72 | Exceptional 5.0% |
| Greeks | 97.0 /100 | #73 | Exceptional 5.0% |
| Immigrants | North America | 96.9 /100 | #74 | Exceptional 5.0% |
| Assyrians/Chaldeans/Syriacs | 96.9 /100 | #75 | Exceptional 5.0% |
| Immigrants | Sudan | 96.5 /100 | #76 | Exceptional 5.0% |
| Iranians | 96.4 /100 | #77 | Exceptional 5.0% |
| Immigrants | Northern Europe | 96.4 /100 | #78 | Exceptional 5.0% |
| South Africans | 96.4 /100 | #79 | Exceptional 5.0% |
| Argentineans | 96.2 /100 | #80 | Exceptional 5.0% |
| French | 96.2 /100 | #81 | Exceptional 5.0% |
| Chileans | 96.2 /100 | #82 | Exceptional 5.0% |