Immigrants from Serbia vs Assyrian/Chaldean/Syriac Male Unemployment
COMPARE
Immigrants from Serbia
Assyrian/Chaldean/Syriac
Male Unemployment
Male Unemployment Comparison
Immigrants from Serbia
Assyrians/Chaldeans/Syriacs
5.1%
MALE UNEMPLOYMENT
94.2/ 100
METRIC RATING
93rd/ 347
METRIC RANK
5.0%
MALE UNEMPLOYMENT
96.9/ 100
METRIC RATING
75th/ 347
METRIC RANK
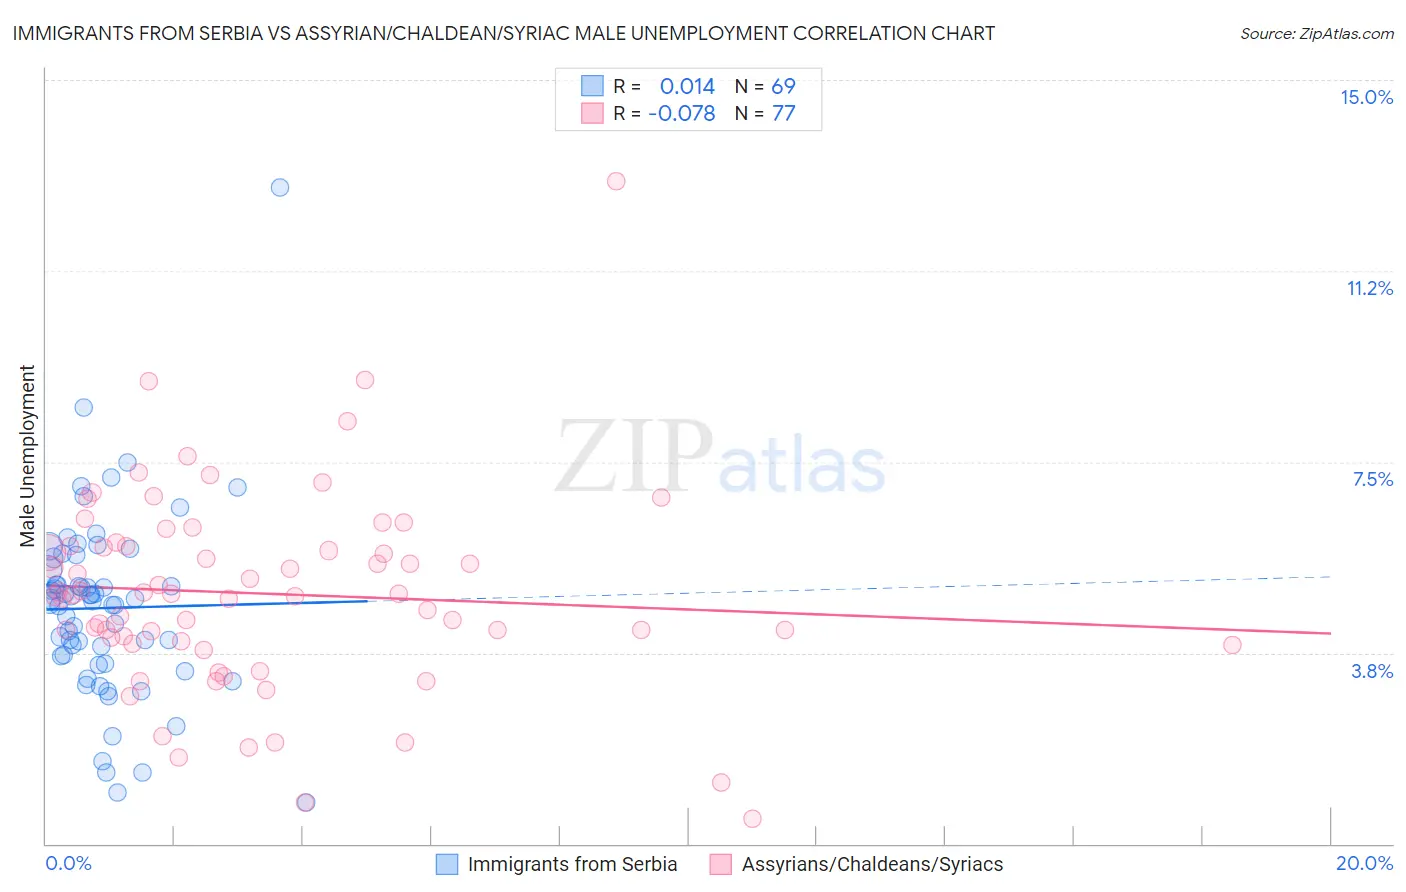
Immigrants from Serbia vs Assyrian/Chaldean/Syriac Male Unemployment Correlation Chart
The statistical analysis conducted on geographies consisting of 131,612,227 people shows no correlation between the proportion of Immigrants from Serbia and unemployment rate among males in the United States with a correlation coefficient (R) of 0.014 and weighted average of 5.1%. Similarly, the statistical analysis conducted on geographies consisting of 110,205,366 people shows a slight negative correlation between the proportion of Assyrians/Chaldeans/Syriacs and unemployment rate among males in the United States with a correlation coefficient (R) of -0.078 and weighted average of 5.0%, a difference of 0.97%.
Male Unemployment Correlation Summary
| Measurement | Immigrants from Serbia | Assyrian/Chaldean/Syriac |
| Minimum | 0.80% | 0.50% |
| Maximum | 12.9% | 13.0% |
| Range | 12.1% | 12.5% |
| Mean | 4.6% | 4.9% |
| Median | 4.8% | 4.9% |
| Interquartile 25% (IQ1) | 3.6% | 3.9% |
| Interquartile 75% (IQ3) | 5.5% | 5.8% |
| Interquartile Range (IQR) | 1.9% | 1.9% |
| Standard Deviation (Sample) | 1.8% | 2.0% |
| Standard Deviation (Population) | 1.8% | 2.0% |
Demographics Similar to Immigrants from Serbia and Assyrians/Chaldeans/Syriacs by Male Unemployment
In terms of male unemployment, the demographic groups most similar to Immigrants from Serbia are Slavic (5.1%, a difference of 0.0%), Canadian (5.1%, a difference of 0.050%), Immigrants from Turkey (5.1%, a difference of 0.060%), Okinawan (5.1%, a difference of 0.14%), and Immigrants from Australia (5.1%, a difference of 0.15%). Similarly, the demographic groups most similar to Assyrians/Chaldeans/Syriacs are Immigrants from North America (5.0%, a difference of 0.030%), Immigrants from Sudan (5.0%, a difference of 0.16%), Iranian (5.0%, a difference of 0.21%), Immigrants from Northern Europe (5.0%, a difference of 0.22%), and South African (5.0%, a difference of 0.23%).
| Demographics | Rating | Rank | Male Unemployment |
| Immigrants | North America | 96.9 /100 | #74 | Exceptional 5.0% |
| Assyrians/Chaldeans/Syriacs | 96.9 /100 | #75 | Exceptional 5.0% |
| Immigrants | Sudan | 96.5 /100 | #76 | Exceptional 5.0% |
| Iranians | 96.4 /100 | #77 | Exceptional 5.0% |
| Immigrants | Northern Europe | 96.4 /100 | #78 | Exceptional 5.0% |
| South Africans | 96.4 /100 | #79 | Exceptional 5.0% |
| Argentineans | 96.2 /100 | #80 | Exceptional 5.0% |
| French | 96.2 /100 | #81 | Exceptional 5.0% |
| Chileans | 96.2 /100 | #82 | Exceptional 5.0% |
| Immigrants | Eritrea | 96.0 /100 | #83 | Exceptional 5.0% |
| Serbians | 95.7 /100 | #84 | Exceptional 5.1% |
| Immigrants | North Macedonia | 95.6 /100 | #85 | Exceptional 5.1% |
| Maltese | 95.5 /100 | #86 | Exceptional 5.1% |
| Immigrants | Romania | 95.4 /100 | #87 | Exceptional 5.1% |
| Immigrants | Sri Lanka | 94.9 /100 | #88 | Exceptional 5.1% |
| Immigrants | Australia | 94.7 /100 | #89 | Exceptional 5.1% |
| Okinawans | 94.7 /100 | #90 | Exceptional 5.1% |
| Immigrants | Turkey | 94.4 /100 | #91 | Exceptional 5.1% |
| Slavs | 94.2 /100 | #92 | Exceptional 5.1% |
| Immigrants | Serbia | 94.2 /100 | #93 | Exceptional 5.1% |
| Canadians | 94.1 /100 | #94 | Exceptional 5.1% |