Aleut vs Crow Unemployment
COMPARE
Aleut
Crow
Unemployment
Unemployment Comparison
Aleuts
Crow
6.1%
UNEMPLOYMENT
0.0/ 100
METRIC RATING
284th/ 347
METRIC RANK
11.1%
UNEMPLOYMENT
0.0/ 100
METRIC RATING
346th/ 347
METRIC RANK
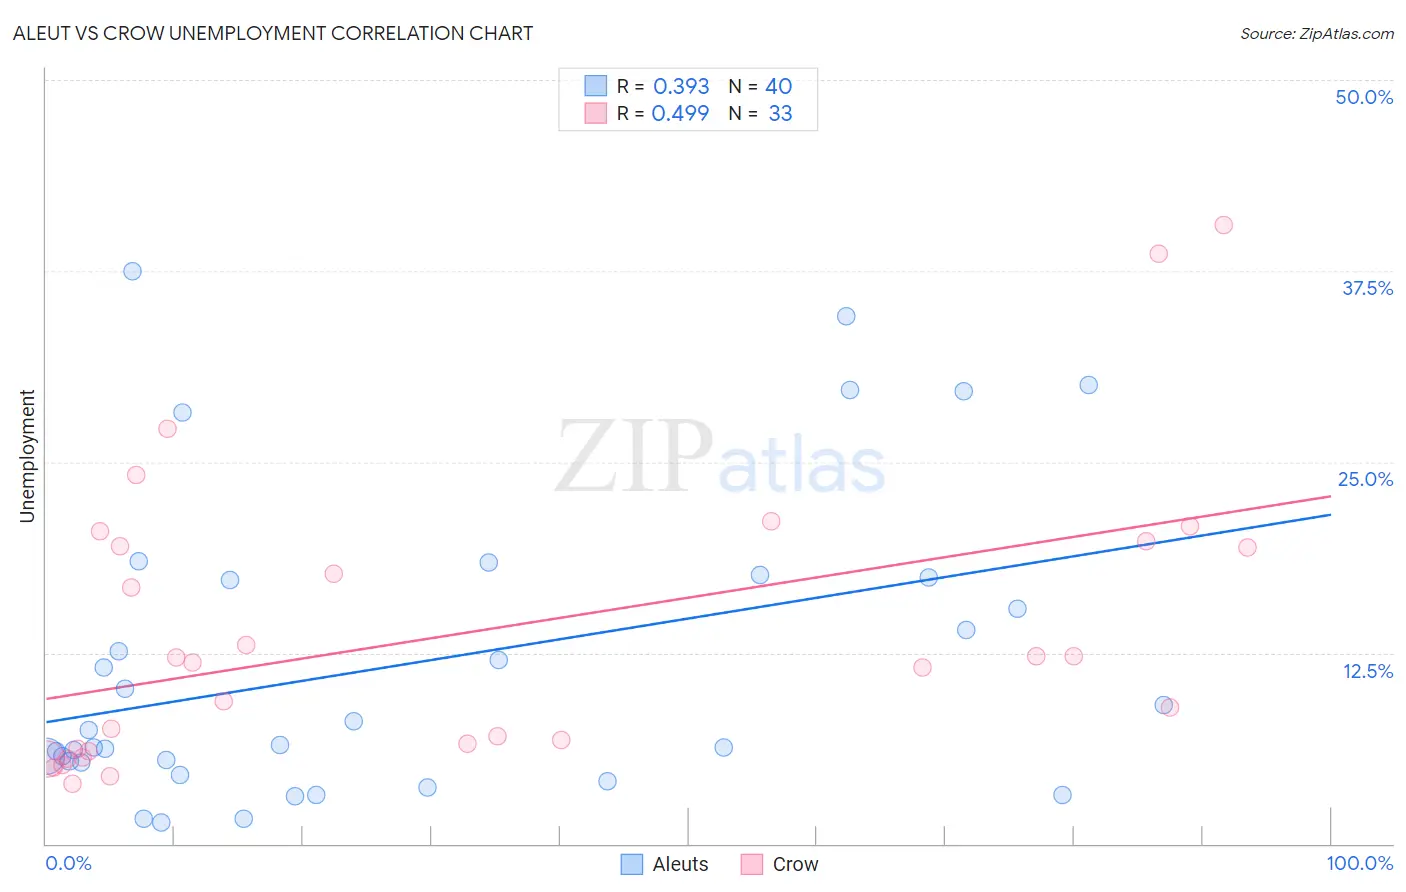
Aleut vs Crow Unemployment Correlation Chart
The statistical analysis conducted on geographies consisting of 61,764,375 people shows a mild positive correlation between the proportion of Aleuts and unemployment in the United States with a correlation coefficient (R) of 0.393 and weighted average of 6.1%. Similarly, the statistical analysis conducted on geographies consisting of 59,183,327 people shows a moderate positive correlation between the proportion of Crow and unemployment in the United States with a correlation coefficient (R) of 0.499 and weighted average of 11.1%, a difference of 82.2%.
Unemployment Correlation Summary
| Measurement | Aleut | Crow |
| Minimum | 1.4% | 3.9% |
| Maximum | 37.5% | 40.5% |
| Range | 36.1% | 36.6% |
| Mean | 11.8% | 13.7% |
| Median | 7.0% | 11.9% |
| Interquartile 25% (IQ1) | 5.4% | 6.1% |
| Interquartile 75% (IQ3) | 17.4% | 19.6% |
| Interquartile Range (IQR) | 12.0% | 13.5% |
| Standard Deviation (Sample) | 9.8% | 9.3% |
| Standard Deviation (Population) | 9.7% | 9.2% |
Similar Demographics by Unemployment
Demographics Similar to Aleuts by Unemployment
In terms of unemployment, the demographic groups most similar to Aleuts are Immigrants from Ghana (6.1%, a difference of 0.13%), Immigrants from the Azores (6.1%, a difference of 0.21%), African (6.1%, a difference of 0.28%), Immigrants from Mexico (6.0%, a difference of 0.86%), and Immigrants from Western Africa (6.0%, a difference of 0.86%).
| Demographics | Rating | Rank | Unemployment |
| Armenians | 0.0 /100 | #277 | Tragic 6.0% |
| Ghanaians | 0.0 /100 | #278 | Tragic 6.0% |
| Immigrants | Mexico | 0.0 /100 | #279 | Tragic 6.0% |
| Immigrants | Western Africa | 0.0 /100 | #280 | Tragic 6.0% |
| Africans | 0.0 /100 | #281 | Tragic 6.1% |
| Immigrants | Azores | 0.0 /100 | #282 | Tragic 6.1% |
| Immigrants | Ghana | 0.0 /100 | #283 | Tragic 6.1% |
| Aleuts | 0.0 /100 | #284 | Tragic 6.1% |
| Immigrants | Senegal | 0.0 /100 | #285 | Tragic 6.1% |
| Immigrants | Caribbean | 0.0 /100 | #286 | Tragic 6.2% |
| Nepalese | 0.0 /100 | #287 | Tragic 6.2% |
| Ecuadorians | 0.0 /100 | #288 | Tragic 6.2% |
| Chippewa | 0.0 /100 | #289 | Tragic 6.2% |
| Senegalese | 0.0 /100 | #290 | Tragic 6.2% |
| Haitians | 0.0 /100 | #291 | Tragic 6.2% |
Demographics Similar to Crow by Unemployment
In terms of unemployment, the demographic groups most similar to Crow are Inupiat (10.1%, a difference of 9.4%), Arapaho (9.8%, a difference of 12.6%), Yuman (9.1%, a difference of 22.0%), Yup'ik (13.6%, a difference of 23.3%), and Hopi (8.9%, a difference of 24.1%).
| Demographics | Rating | Rank | Unemployment |
| Immigrants | Dominican Republic | 0.0 /100 | #333 | Tragic 7.4% |
| Apache | 0.0 /100 | #334 | Tragic 7.4% |
| Alaskan Athabascans | 0.0 /100 | #335 | Tragic 7.7% |
| Immigrants | Yemen | 0.0 /100 | #336 | Tragic 7.7% |
| Cheyenne | 0.0 /100 | #337 | Tragic 8.0% |
| Pima | 0.0 /100 | #338 | Tragic 8.2% |
| Navajo | 0.0 /100 | #339 | Tragic 8.4% |
| Puerto Ricans | 0.0 /100 | #340 | Tragic 8.4% |
| Tohono O'odham | 0.0 /100 | #341 | Tragic 8.9% |
| Hopi | 0.0 /100 | #342 | Tragic 8.9% |
| Yuman | 0.0 /100 | #343 | Tragic 9.1% |
| Arapaho | 0.0 /100 | #344 | Tragic 9.8% |
| Inupiat | 0.0 /100 | #345 | Tragic 10.1% |
| Crow | 0.0 /100 | #346 | Tragic 11.1% |
| Yup'ik | 0.0 /100 | #347 | Tragic 13.6% |