Immigrants from Uganda vs Korean Unemployment Among Women with Children Ages 6 to 17 years
COMPARE
Immigrants from Uganda
Korean
Unemployment Among Women with Children Ages 6 to 17 years
Unemployment Among Women with Children Ages 6 to 17 years Comparison
Immigrants from Uganda
Koreans
10.7%
UNEMPLOYMENT AMONG WOMEN WITH CHILDREN AGES 6 TO 17 YEARS
0.0/ 100
METRIC RATING
319th/ 347
METRIC RANK
8.2%
UNEMPLOYMENT AMONG WOMEN WITH CHILDREN AGES 6 TO 17 YEARS
100.0/ 100
METRIC RATING
61st/ 347
METRIC RANK
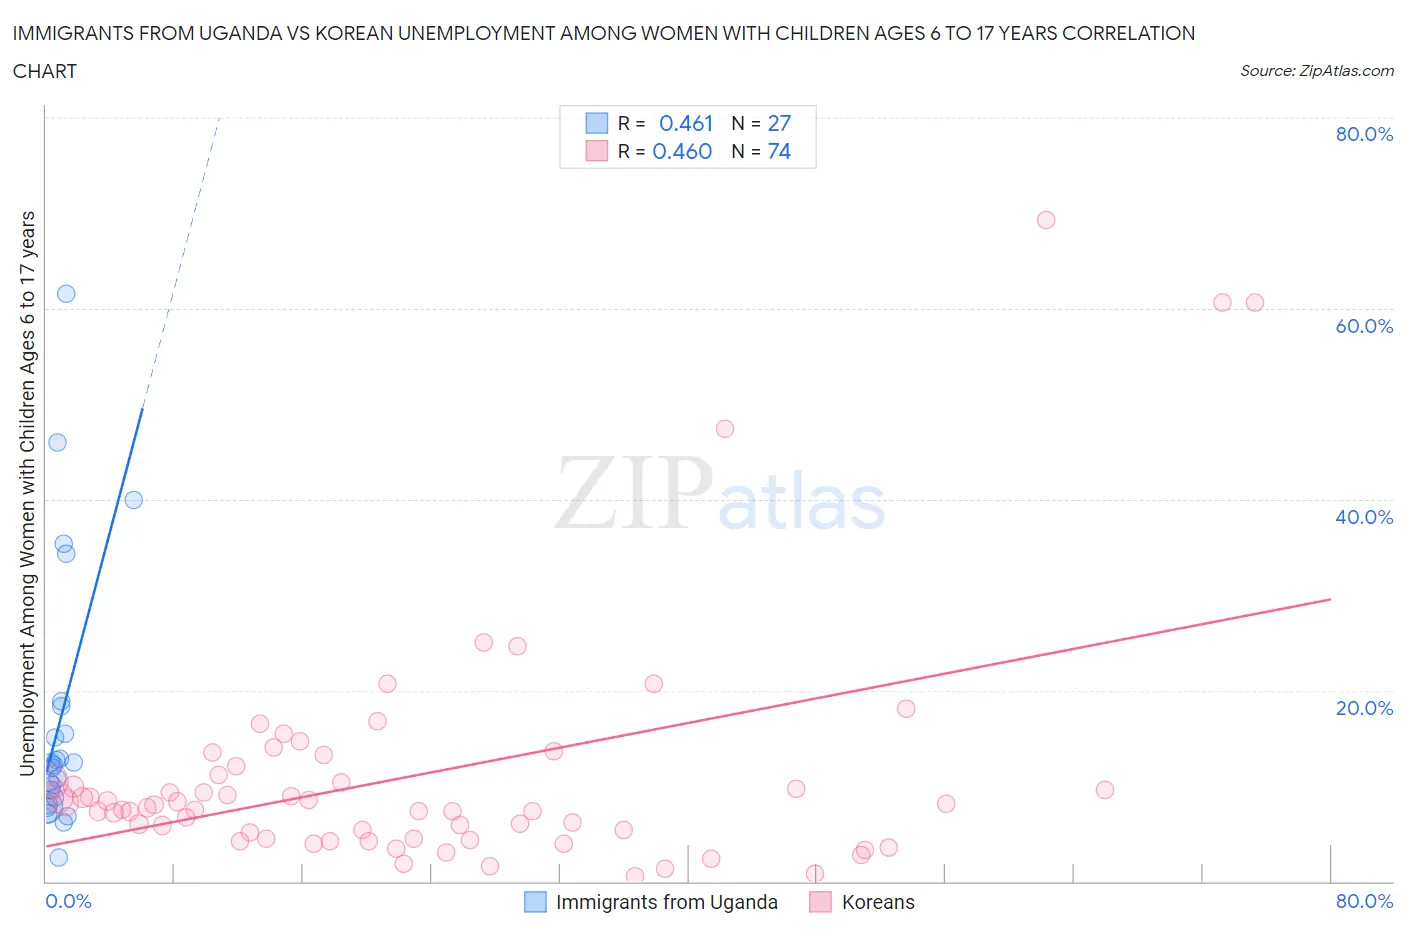
Immigrants from Uganda vs Korean Unemployment Among Women with Children Ages 6 to 17 years Correlation Chart
The statistical analysis conducted on geographies consisting of 110,485,148 people shows a moderate positive correlation between the proportion of Immigrants from Uganda and unemployment rate among women with children between the ages 6 and 17 in the United States with a correlation coefficient (R) of 0.461 and weighted average of 10.7%. Similarly, the statistical analysis conducted on geographies consisting of 342,207,280 people shows a moderate positive correlation between the proportion of Koreans and unemployment rate among women with children between the ages 6 and 17 in the United States with a correlation coefficient (R) of 0.460 and weighted average of 8.2%, a difference of 29.9%.
Unemployment Among Women with Children Ages 6 to 17 years Correlation Summary
| Measurement | Immigrants from Uganda | Korean |
| Minimum | 2.5% | 0.50% |
| Maximum | 61.5% | 69.2% |
| Range | 59.0% | 68.7% |
| Mean | 16.9% | 11.2% |
| Median | 12.1% | 7.9% |
| Interquartile 25% (IQ1) | 8.1% | 4.5% |
| Interquartile 75% (IQ3) | 18.3% | 11.2% |
| Interquartile Range (IQR) | 10.2% | 6.6% |
| Standard Deviation (Sample) | 14.1% | 12.8% |
| Standard Deviation (Population) | 13.8% | 12.8% |
Similar Demographics by Unemployment Among Women with Children Ages 6 to 17 years
Demographics Similar to Immigrants from Uganda by Unemployment Among Women with Children Ages 6 to 17 years
In terms of unemployment among women with children ages 6 to 17 years, the demographic groups most similar to Immigrants from Uganda are Apache (10.7%, a difference of 0.020%), Tohono O'odham (10.7%, a difference of 0.19%), Delaware (10.5%, a difference of 1.3%), Bermudan (10.5%, a difference of 1.3%), and Immigrants from Dominica (10.5%, a difference of 1.4%).
| Demographics | Rating | Rank | Unemployment Among Women with Children Ages 6 to 17 years |
| Africans | 0.0 /100 | #312 | Tragic 10.4% |
| Americans | 0.0 /100 | #313 | Tragic 10.4% |
| Immigrants | Cabo Verde | 0.0 /100 | #314 | Tragic 10.4% |
| Bahamians | 0.0 /100 | #315 | Tragic 10.4% |
| Immigrants | Dominica | 0.0 /100 | #316 | Tragic 10.5% |
| Bermudans | 0.0 /100 | #317 | Tragic 10.5% |
| Delaware | 0.0 /100 | #318 | Tragic 10.5% |
| Immigrants | Uganda | 0.0 /100 | #319 | Tragic 10.7% |
| Apache | 0.0 /100 | #320 | Tragic 10.7% |
| Tohono O'odham | 0.0 /100 | #321 | Tragic 10.7% |
| Cree | 0.0 /100 | #322 | Tragic 10.8% |
| Dominicans | 0.0 /100 | #323 | Tragic 10.8% |
| Immigrants | Dominican Republic | 0.0 /100 | #324 | Tragic 10.8% |
| Cajuns | 0.0 /100 | #325 | Tragic 10.8% |
| Liberians | 0.0 /100 | #326 | Tragic 10.8% |
Demographics Similar to Koreans by Unemployment Among Women with Children Ages 6 to 17 years
In terms of unemployment among women with children ages 6 to 17 years, the demographic groups most similar to Koreans are Spanish American Indian (8.2%, a difference of 0.030%), Basque (8.2%, a difference of 0.18%), Immigrants from Philippines (8.2%, a difference of 0.19%), Immigrants from Malaysia (8.2%, a difference of 0.25%), and Immigrants from South Eastern Asia (8.2%, a difference of 0.43%).
| Demographics | Rating | Rank | Unemployment Among Women with Children Ages 6 to 17 years |
| Immigrants | Armenia | 100.0 /100 | #54 | Exceptional 8.2% |
| Immigrants | Japan | 100.0 /100 | #55 | Exceptional 8.2% |
| Immigrants | Bosnia and Herzegovina | 100.0 /100 | #56 | Exceptional 8.2% |
| Immigrants | Laos | 100.0 /100 | #57 | Exceptional 8.2% |
| Immigrants | Malaysia | 100.0 /100 | #58 | Exceptional 8.2% |
| Immigrants | Philippines | 100.0 /100 | #59 | Exceptional 8.2% |
| Basques | 100.0 /100 | #60 | Exceptional 8.2% |
| Koreans | 100.0 /100 | #61 | Exceptional 8.2% |
| Spanish American Indians | 100.0 /100 | #62 | Exceptional 8.2% |
| Immigrants | South Eastern Asia | 99.9 /100 | #63 | Exceptional 8.2% |
| Immigrants | Kuwait | 99.9 /100 | #64 | Exceptional 8.3% |
| Immigrants | Albania | 99.9 /100 | #65 | Exceptional 8.3% |
| Luxembourgers | 99.9 /100 | #66 | Exceptional 8.3% |
| Armenians | 99.9 /100 | #67 | Exceptional 8.3% |
| Marshallese | 99.9 /100 | #68 | Exceptional 8.3% |