Immigrants from Sierra Leone vs Immigrants from Lithuania Unemployment
COMPARE
Immigrants from Sierra Leone
Immigrants from Lithuania
Unemployment
Unemployment Comparison
Immigrants from Sierra Leone
Immigrants from Lithuania
5.8%
UNEMPLOYMENT
0.1/ 100
METRIC RATING
268th/ 347
METRIC RANK
5.0%
UNEMPLOYMENT
93.2/ 100
METRIC RATING
110th/ 347
METRIC RANK
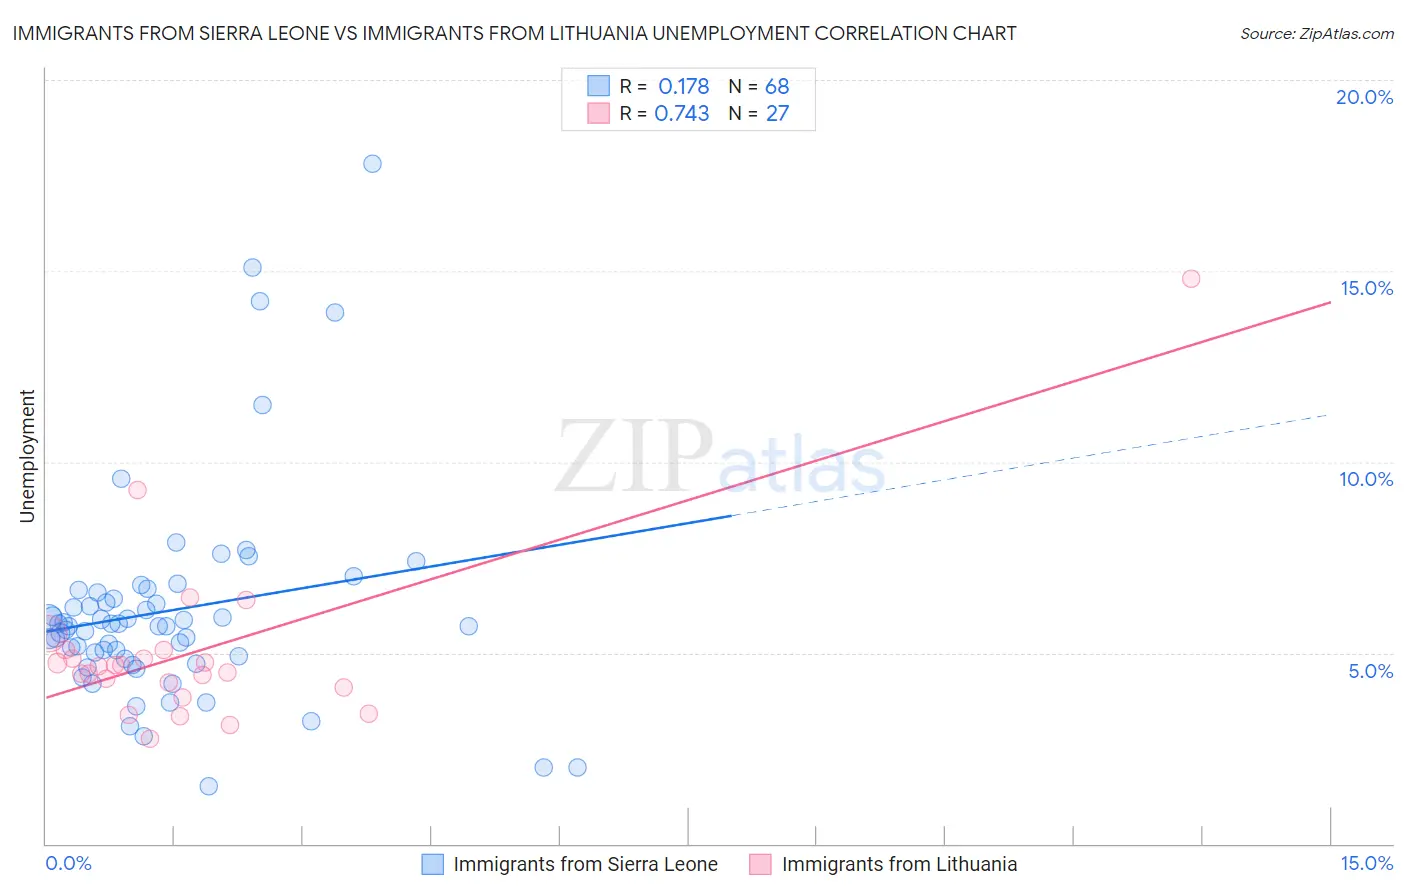
Immigrants from Sierra Leone vs Immigrants from Lithuania Unemployment Correlation Chart
The statistical analysis conducted on geographies consisting of 101,634,526 people shows a poor positive correlation between the proportion of Immigrants from Sierra Leone and unemployment in the United States with a correlation coefficient (R) of 0.178 and weighted average of 5.8%. Similarly, the statistical analysis conducted on geographies consisting of 117,711,175 people shows a strong positive correlation between the proportion of Immigrants from Lithuania and unemployment in the United States with a correlation coefficient (R) of 0.743 and weighted average of 5.0%, a difference of 15.8%.
Unemployment Correlation Summary
| Measurement | Immigrants from Sierra Leone | Immigrants from Lithuania |
| Minimum | 1.5% | 2.7% |
| Maximum | 17.8% | 14.8% |
| Range | 16.3% | 12.1% |
| Mean | 6.1% | 5.0% |
| Median | 5.7% | 4.7% |
| Interquartile 25% (IQ1) | 4.9% | 4.1% |
| Interquartile 75% (IQ3) | 6.5% | 5.1% |
| Interquartile Range (IQR) | 1.6% | 0.96% |
| Standard Deviation (Sample) | 2.8% | 2.3% |
| Standard Deviation (Population) | 2.8% | 2.3% |
Similar Demographics by Unemployment
Demographics Similar to Immigrants from Sierra Leone by Unemployment
In terms of unemployment, the demographic groups most similar to Immigrants from Sierra Leone are Immigrants from El Salvador (5.8%, a difference of 0.010%), Immigrants from Nigeria (5.8%, a difference of 0.040%), Blackfeet (5.8%, a difference of 0.090%), Mexican American Indian (5.8%, a difference of 0.11%), and Mexican (5.9%, a difference of 0.32%).
| Demographics | Rating | Rank | Unemployment |
| Immigrants | Guatemala | 0.1 /100 | #261 | Tragic 5.8% |
| Sierra Leoneans | 0.1 /100 | #262 | Tragic 5.8% |
| Salvadorans | 0.1 /100 | #263 | Tragic 5.8% |
| Immigrants | Liberia | 0.1 /100 | #264 | Tragic 5.8% |
| Nigerians | 0.1 /100 | #265 | Tragic 5.8% |
| Mexican American Indians | 0.1 /100 | #266 | Tragic 5.8% |
| Immigrants | Nigeria | 0.1 /100 | #267 | Tragic 5.8% |
| Immigrants | Sierra Leone | 0.1 /100 | #268 | Tragic 5.8% |
| Immigrants | El Salvador | 0.1 /100 | #269 | Tragic 5.8% |
| Blackfeet | 0.1 /100 | #270 | Tragic 5.8% |
| Mexicans | 0.1 /100 | #271 | Tragic 5.9% |
| Hispanics or Latinos | 0.0 /100 | #272 | Tragic 5.9% |
| Immigrants | Fiji | 0.0 /100 | #273 | Tragic 5.9% |
| Bahamians | 0.0 /100 | #274 | Tragic 5.9% |
| Immigrants | Latin America | 0.0 /100 | #275 | Tragic 5.9% |
Demographics Similar to Immigrants from Lithuania by Unemployment
In terms of unemployment, the demographic groups most similar to Immigrants from Lithuania are Chilean (5.0%, a difference of 0.0%), Immigrants from Eritrea (5.0%, a difference of 0.020%), Immigrants from Kuwait (5.0%, a difference of 0.12%), Immigrants from Turkey (5.0%, a difference of 0.13%), and Immigrants from Romania (5.0%, a difference of 0.14%).
| Demographics | Rating | Rank | Unemployment |
| Chickasaw | 94.0 /100 | #103 | Exceptional 5.0% |
| Osage | 94.0 /100 | #104 | Exceptional 5.0% |
| Maltese | 94.0 /100 | #105 | Exceptional 5.0% |
| Immigrants | Romania | 93.7 /100 | #106 | Exceptional 5.0% |
| Immigrants | Turkey | 93.7 /100 | #107 | Exceptional 5.0% |
| Immigrants | Kuwait | 93.7 /100 | #108 | Exceptional 5.0% |
| Immigrants | Eritrea | 93.3 /100 | #109 | Exceptional 5.0% |
| Immigrants | Lithuania | 93.2 /100 | #110 | Exceptional 5.0% |
| Chileans | 93.2 /100 | #111 | Exceptional 5.0% |
| South Africans | 92.6 /100 | #112 | Exceptional 5.1% |
| Argentineans | 92.4 /100 | #113 | Exceptional 5.1% |
| Immigrants | Ireland | 92.1 /100 | #114 | Exceptional 5.1% |
| Immigrants | Western Europe | 91.1 /100 | #115 | Exceptional 5.1% |
| Immigrants | Sri Lanka | 91.1 /100 | #116 | Exceptional 5.1% |
| Immigrants | Malaysia | 91.0 /100 | #117 | Exceptional 5.1% |