Immigrants from Sierra Leone vs Greek Unemployment
COMPARE
Immigrants from Sierra Leone
Greek
Unemployment
Unemployment Comparison
Immigrants from Sierra Leone
Greeks
5.8%
UNEMPLOYMENT
0.1/ 100
METRIC RATING
268th/ 347
METRIC RANK
4.9%
UNEMPLOYMENT
99.0/ 100
METRIC RATING
58th/ 347
METRIC RANK
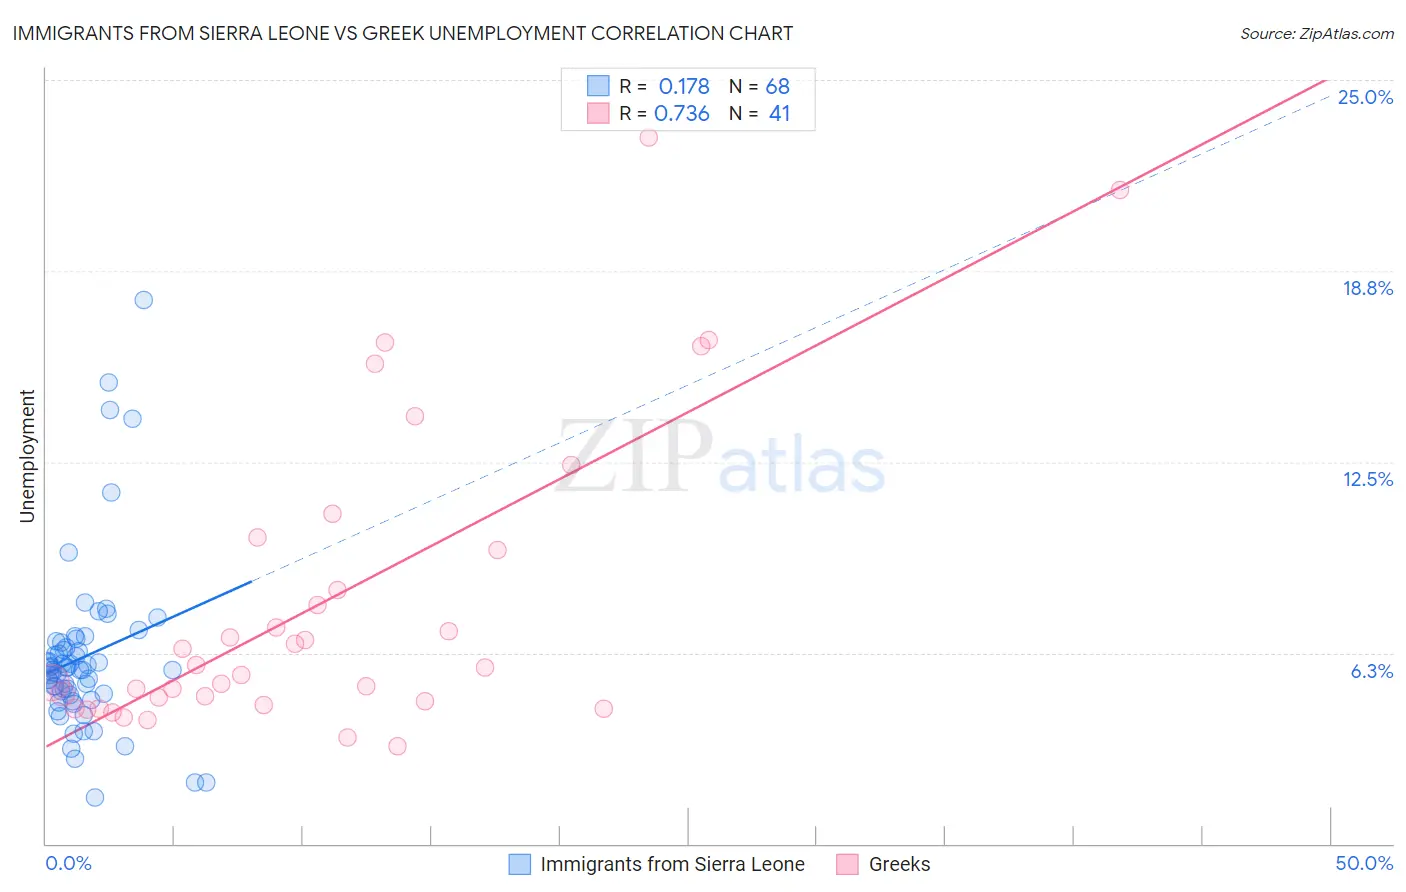
Immigrants from Sierra Leone vs Greek Unemployment Correlation Chart
The statistical analysis conducted on geographies consisting of 101,634,526 people shows a poor positive correlation between the proportion of Immigrants from Sierra Leone and unemployment in the United States with a correlation coefficient (R) of 0.178 and weighted average of 5.8%. Similarly, the statistical analysis conducted on geographies consisting of 481,787,990 people shows a strong positive correlation between the proportion of Greeks and unemployment in the United States with a correlation coefficient (R) of 0.736 and weighted average of 4.9%, a difference of 19.5%.
Unemployment Correlation Summary
| Measurement | Immigrants from Sierra Leone | Greek |
| Minimum | 1.5% | 3.2% |
| Maximum | 17.8% | 23.1% |
| Range | 16.3% | 19.9% |
| Mean | 6.1% | 8.0% |
| Median | 5.7% | 5.8% |
| Interquartile 25% (IQ1) | 4.9% | 4.6% |
| Interquartile 75% (IQ3) | 6.5% | 9.8% |
| Interquartile Range (IQR) | 1.6% | 5.2% |
| Standard Deviation (Sample) | 2.8% | 5.0% |
| Standard Deviation (Population) | 2.8% | 5.0% |
Similar Demographics by Unemployment
Demographics Similar to Immigrants from Sierra Leone by Unemployment
In terms of unemployment, the demographic groups most similar to Immigrants from Sierra Leone are Immigrants from El Salvador (5.8%, a difference of 0.010%), Immigrants from Nigeria (5.8%, a difference of 0.040%), Blackfeet (5.8%, a difference of 0.090%), Mexican American Indian (5.8%, a difference of 0.11%), and Mexican (5.9%, a difference of 0.32%).
| Demographics | Rating | Rank | Unemployment |
| Immigrants | Guatemala | 0.1 /100 | #261 | Tragic 5.8% |
| Sierra Leoneans | 0.1 /100 | #262 | Tragic 5.8% |
| Salvadorans | 0.1 /100 | #263 | Tragic 5.8% |
| Immigrants | Liberia | 0.1 /100 | #264 | Tragic 5.8% |
| Nigerians | 0.1 /100 | #265 | Tragic 5.8% |
| Mexican American Indians | 0.1 /100 | #266 | Tragic 5.8% |
| Immigrants | Nigeria | 0.1 /100 | #267 | Tragic 5.8% |
| Immigrants | Sierra Leone | 0.1 /100 | #268 | Tragic 5.8% |
| Immigrants | El Salvador | 0.1 /100 | #269 | Tragic 5.8% |
| Blackfeet | 0.1 /100 | #270 | Tragic 5.8% |
| Mexicans | 0.1 /100 | #271 | Tragic 5.9% |
| Hispanics or Latinos | 0.0 /100 | #272 | Tragic 5.9% |
| Immigrants | Fiji | 0.0 /100 | #273 | Tragic 5.9% |
| Bahamians | 0.0 /100 | #274 | Tragic 5.9% |
| Immigrants | Latin America | 0.0 /100 | #275 | Tragic 5.9% |
Demographics Similar to Greeks by Unemployment
In terms of unemployment, the demographic groups most similar to Greeks are Bhutanese (4.9%, a difference of 0.030%), Immigrants from Netherlands (4.9%, a difference of 0.070%), Cambodian (4.9%, a difference of 0.070%), Icelander (4.9%, a difference of 0.080%), and Immigrants from Singapore (4.9%, a difference of 0.10%).
| Demographics | Rating | Rank | Unemployment |
| Immigrants | Belgium | 99.2 /100 | #51 | Exceptional 4.9% |
| Whites/Caucasians | 99.2 /100 | #52 | Exceptional 4.9% |
| Immigrants | Zimbabwe | 99.2 /100 | #53 | Exceptional 4.9% |
| Eastern Europeans | 99.2 /100 | #54 | Exceptional 4.9% |
| Australians | 99.2 /100 | #55 | Exceptional 4.9% |
| Celtics | 99.1 /100 | #56 | Exceptional 4.9% |
| Immigrants | Singapore | 99.1 /100 | #57 | Exceptional 4.9% |
| Greeks | 99.0 /100 | #58 | Exceptional 4.9% |
| Bhutanese | 99.0 /100 | #59 | Exceptional 4.9% |
| Immigrants | Netherlands | 99.0 /100 | #60 | Exceptional 4.9% |
| Cambodians | 99.0 /100 | #61 | Exceptional 4.9% |
| Icelanders | 98.9 /100 | #62 | Exceptional 4.9% |
| Immigrants | Bulgaria | 98.9 /100 | #63 | Exceptional 4.9% |
| Italians | 98.9 /100 | #64 | Exceptional 4.9% |
| Immigrants | Canada | 98.8 /100 | #65 | Exceptional 4.9% |