Immigrants from Sierra Leone vs White/Caucasian Single Mother Households
COMPARE
Immigrants from Sierra Leone
White/Caucasian
Single Mother Households
Single Mother Households Comparison
Immigrants from Sierra Leone
Whites/Caucasians
7.7%
SINGLE MOTHER HOUSEHOLDS
0.0/ 100
METRIC RATING
280th/ 347
METRIC RANK
6.1%
SINGLE MOTHER HOUSEHOLDS
76.5/ 100
METRIC RATING
155th/ 347
METRIC RANK
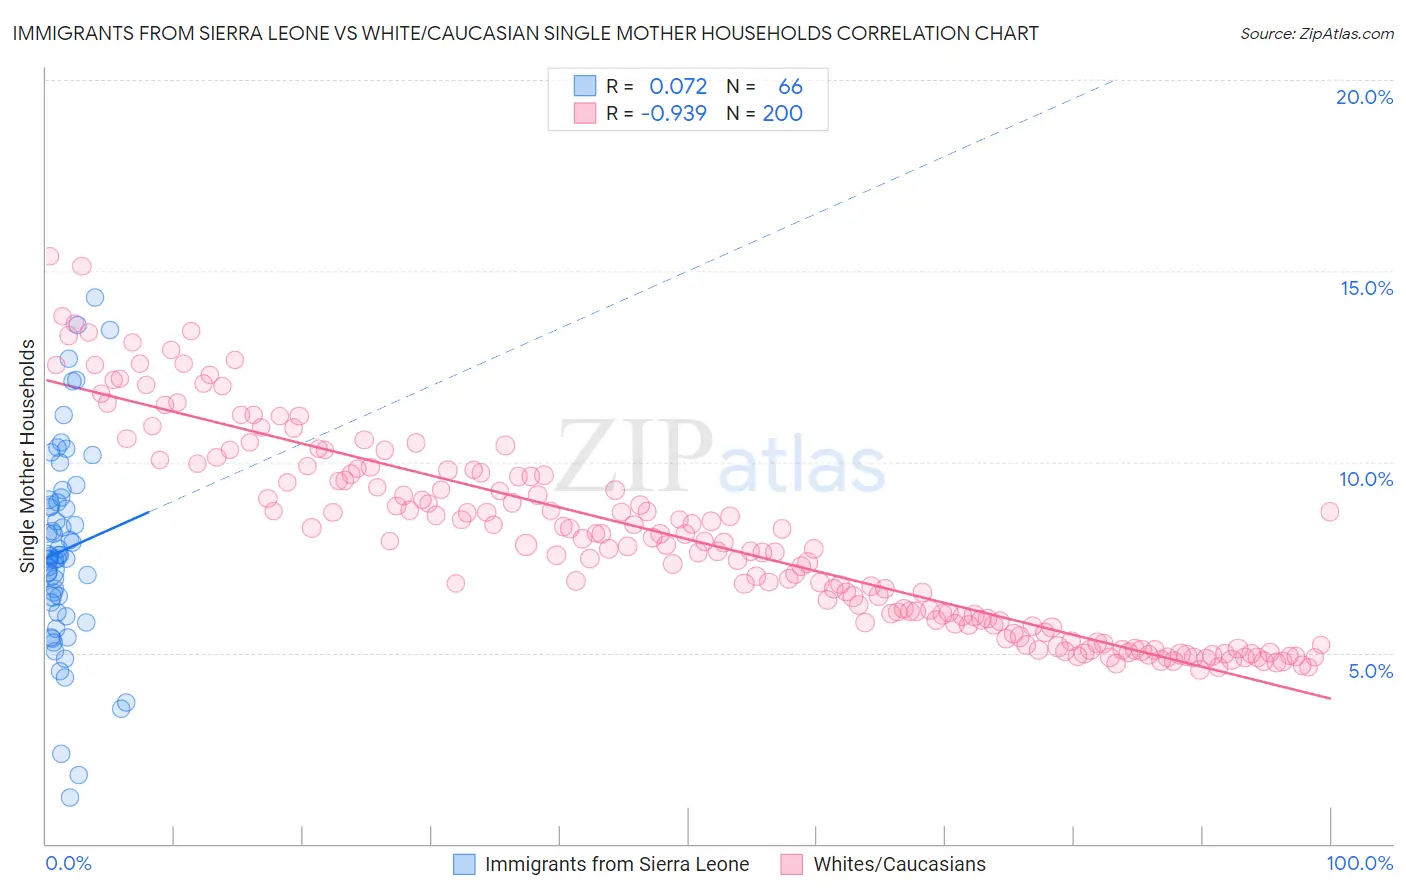
Immigrants from Sierra Leone vs White/Caucasian Single Mother Households Correlation Chart
The statistical analysis conducted on geographies consisting of 101,563,361 people shows a slight positive correlation between the proportion of Immigrants from Sierra Leone and percentage of single mother households in the United States with a correlation coefficient (R) of 0.072 and weighted average of 7.7%. Similarly, the statistical analysis conducted on geographies consisting of 577,516,213 people shows a near-perfect negative correlation between the proportion of Whites/Caucasians and percentage of single mother households in the United States with a correlation coefficient (R) of -0.939 and weighted average of 6.1%, a difference of 25.5%.
Single Mother Households Correlation Summary
| Measurement | Immigrants from Sierra Leone | White/Caucasian |
| Minimum | 1.2% | 4.6% |
| Maximum | 14.3% | 15.4% |
| Range | 13.1% | 10.8% |
| Mean | 7.7% | 8.0% |
| Median | 7.5% | 7.8% |
| Interquartile 25% (IQ1) | 6.1% | 5.7% |
| Interquartile 75% (IQ3) | 9.0% | 9.7% |
| Interquartile Range (IQR) | 3.0% | 4.0% |
| Standard Deviation (Sample) | 2.7% | 2.6% |
| Standard Deviation (Population) | 2.7% | 2.6% |
Similar Demographics by Single Mother Households
Demographics Similar to Immigrants from Sierra Leone by Single Mother Households
In terms of single mother households, the demographic groups most similar to Immigrants from Sierra Leone are Immigrants from Laos (7.7%, a difference of 0.0%), Guatemalan (7.7%, a difference of 0.020%), Nigerian (7.7%, a difference of 0.050%), Immigrants from El Salvador (7.6%, a difference of 0.52%), and Immigrants from Belize (7.7%, a difference of 0.65%).
| Demographics | Rating | Rank | Single Mother Households |
| Belizeans | 0.1 /100 | #273 | Tragic 7.6% |
| Immigrants | Guyana | 0.1 /100 | #274 | Tragic 7.6% |
| Central American Indians | 0.1 /100 | #275 | Tragic 7.6% |
| Guyanese | 0.1 /100 | #276 | Tragic 7.6% |
| Immigrants | Trinidad and Tobago | 0.1 /100 | #277 | Tragic 7.6% |
| Central Americans | 0.1 /100 | #278 | Tragic 7.6% |
| Immigrants | El Salvador | 0.0 /100 | #279 | Tragic 7.6% |
| Immigrants | Sierra Leone | 0.0 /100 | #280 | Tragic 7.7% |
| Immigrants | Laos | 0.0 /100 | #281 | Tragic 7.7% |
| Guatemalans | 0.0 /100 | #282 | Tragic 7.7% |
| Nigerians | 0.0 /100 | #283 | Tragic 7.7% |
| Immigrants | Belize | 0.0 /100 | #284 | Tragic 7.7% |
| Trinidadians and Tobagonians | 0.0 /100 | #285 | Tragic 7.7% |
| Immigrants | Middle Africa | 0.0 /100 | #286 | Tragic 7.7% |
| Immigrants | Guatemala | 0.0 /100 | #287 | Tragic 7.7% |
Demographics Similar to Whites/Caucasians by Single Mother Households
In terms of single mother households, the demographic groups most similar to Whites/Caucasians are Native Hawaiian (6.1%, a difference of 0.23%), Immigrants from Philippines (6.1%, a difference of 0.33%), Chilean (6.1%, a difference of 0.34%), Immigrants from Brazil (6.1%, a difference of 0.40%), and Pakistani (6.1%, a difference of 0.44%).
| Demographics | Rating | Rank | Single Mother Households |
| Scotch-Irish | 82.0 /100 | #148 | Excellent 6.0% |
| Immigrants | Albania | 81.5 /100 | #149 | Excellent 6.1% |
| Zimbabweans | 80.7 /100 | #150 | Excellent 6.1% |
| Immigrants | Southern Europe | 80.5 /100 | #151 | Excellent 6.1% |
| Pakistanis | 79.2 /100 | #152 | Good 6.1% |
| Immigrants | Brazil | 78.9 /100 | #153 | Good 6.1% |
| Immigrants | Philippines | 78.5 /100 | #154 | Good 6.1% |
| Whites/Caucasians | 76.5 /100 | #155 | Good 6.1% |
| Native Hawaiians | 75.0 /100 | #156 | Good 6.1% |
| Chileans | 74.2 /100 | #157 | Good 6.1% |
| Celtics | 73.3 /100 | #158 | Good 6.1% |
| Yugoslavians | 73.1 /100 | #159 | Good 6.1% |
| Iraqis | 73.0 /100 | #160 | Good 6.1% |
| Immigrants | Germany | 72.4 /100 | #161 | Good 6.1% |
| Immigrants | Zimbabwe | 69.9 /100 | #162 | Good 6.2% |