Immigrants from Thailand vs Immigrants from Lithuania Unemployment
COMPARE
Immigrants from Thailand
Immigrants from Lithuania
Unemployment
Unemployment Comparison
Immigrants from Thailand
Immigrants from Lithuania
5.3%
UNEMPLOYMENT
38.9/ 100
METRIC RATING
185th/ 347
METRIC RANK
5.0%
UNEMPLOYMENT
93.2/ 100
METRIC RATING
110th/ 347
METRIC RANK
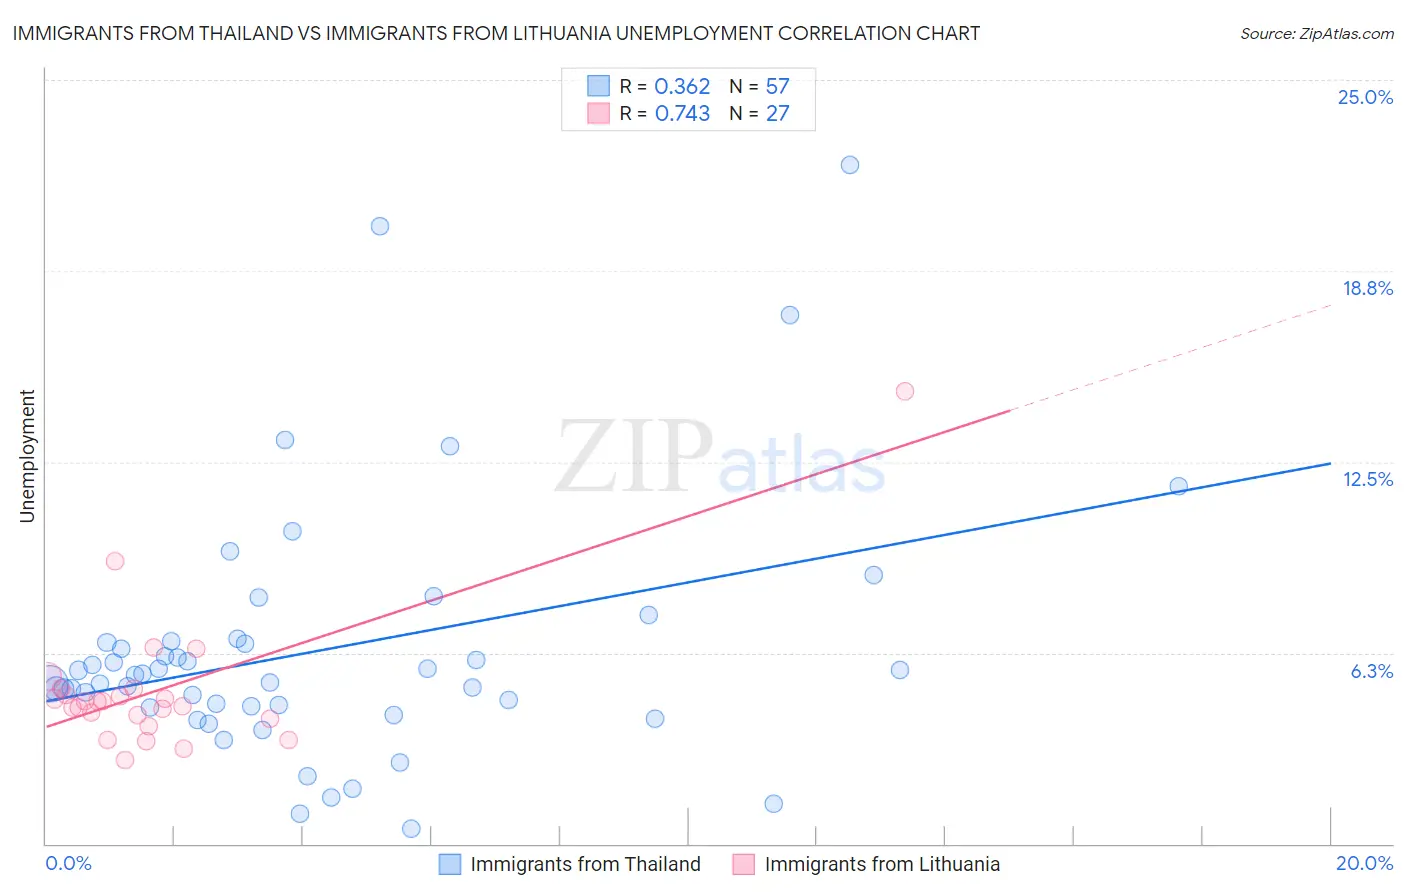
Immigrants from Thailand vs Immigrants from Lithuania Unemployment Correlation Chart
The statistical analysis conducted on geographies consisting of 316,857,394 people shows a mild positive correlation between the proportion of Immigrants from Thailand and unemployment in the United States with a correlation coefficient (R) of 0.362 and weighted average of 5.3%. Similarly, the statistical analysis conducted on geographies consisting of 117,711,175 people shows a strong positive correlation between the proportion of Immigrants from Lithuania and unemployment in the United States with a correlation coefficient (R) of 0.743 and weighted average of 5.0%, a difference of 4.9%.
Unemployment Correlation Summary
| Measurement | Immigrants from Thailand | Immigrants from Lithuania |
| Minimum | 0.50% | 2.7% |
| Maximum | 22.2% | 14.8% |
| Range | 21.7% | 12.1% |
| Mean | 6.3% | 5.0% |
| Median | 5.5% | 4.7% |
| Interquartile 25% (IQ1) | 4.5% | 4.1% |
| Interquartile 75% (IQ3) | 6.6% | 5.1% |
| Interquartile Range (IQR) | 2.1% | 0.96% |
| Standard Deviation (Sample) | 4.1% | 2.3% |
| Standard Deviation (Population) | 4.1% | 2.3% |
Similar Demographics by Unemployment
Demographics Similar to Immigrants from Thailand by Unemployment
In terms of unemployment, the demographic groups most similar to Immigrants from Thailand are Assyrian/Chaldean/Syriac (5.3%, a difference of 0.020%), Immigrants from Uganda (5.3%, a difference of 0.070%), Brazilian (5.3%, a difference of 0.080%), Costa Rican (5.3%, a difference of 0.10%), and Alsatian (5.3%, a difference of 0.12%).
| Demographics | Rating | Rank | Unemployment |
| Afghans | 47.4 /100 | #178 | Average 5.3% |
| Malaysians | 46.8 /100 | #179 | Average 5.3% |
| Immigrants | Greece | 45.0 /100 | #180 | Average 5.3% |
| Albanians | 43.5 /100 | #181 | Average 5.3% |
| Spaniards | 42.2 /100 | #182 | Average 5.3% |
| Brazilians | 40.2 /100 | #183 | Average 5.3% |
| Assyrians/Chaldeans/Syriacs | 39.2 /100 | #184 | Fair 5.3% |
| Immigrants | Thailand | 38.9 /100 | #185 | Fair 5.3% |
| Immigrants | Uganda | 37.8 /100 | #186 | Fair 5.3% |
| Costa Ricans | 37.4 /100 | #187 | Fair 5.3% |
| Alsatians | 37.0 /100 | #188 | Fair 5.3% |
| Immigrants | Belarus | 35.6 /100 | #189 | Fair 5.3% |
| Arabs | 35.3 /100 | #190 | Fair 5.3% |
| Somalis | 34.0 /100 | #191 | Fair 5.3% |
| South Americans | 33.9 /100 | #192 | Fair 5.3% |
Demographics Similar to Immigrants from Lithuania by Unemployment
In terms of unemployment, the demographic groups most similar to Immigrants from Lithuania are Chilean (5.0%, a difference of 0.0%), Immigrants from Eritrea (5.0%, a difference of 0.020%), Immigrants from Kuwait (5.0%, a difference of 0.12%), Immigrants from Turkey (5.0%, a difference of 0.13%), and Immigrants from Romania (5.0%, a difference of 0.14%).
| Demographics | Rating | Rank | Unemployment |
| Chickasaw | 94.0 /100 | #103 | Exceptional 5.0% |
| Osage | 94.0 /100 | #104 | Exceptional 5.0% |
| Maltese | 94.0 /100 | #105 | Exceptional 5.0% |
| Immigrants | Romania | 93.7 /100 | #106 | Exceptional 5.0% |
| Immigrants | Turkey | 93.7 /100 | #107 | Exceptional 5.0% |
| Immigrants | Kuwait | 93.7 /100 | #108 | Exceptional 5.0% |
| Immigrants | Eritrea | 93.3 /100 | #109 | Exceptional 5.0% |
| Immigrants | Lithuania | 93.2 /100 | #110 | Exceptional 5.0% |
| Chileans | 93.2 /100 | #111 | Exceptional 5.0% |
| South Africans | 92.6 /100 | #112 | Exceptional 5.1% |
| Argentineans | 92.4 /100 | #113 | Exceptional 5.1% |
| Immigrants | Ireland | 92.1 /100 | #114 | Exceptional 5.1% |
| Immigrants | Western Europe | 91.1 /100 | #115 | Exceptional 5.1% |
| Immigrants | Sri Lanka | 91.1 /100 | #116 | Exceptional 5.1% |
| Immigrants | Malaysia | 91.0 /100 | #117 | Exceptional 5.1% |