Slovak vs Immigrants from Lithuania Unemployment
COMPARE
Slovak
Immigrants from Lithuania
Unemployment
Unemployment Comparison
Slovaks
Immigrants from Lithuania
4.9%
UNEMPLOYMENT
98.7/ 100
METRIC RATING
66th/ 347
METRIC RANK
5.0%
UNEMPLOYMENT
93.2/ 100
METRIC RATING
110th/ 347
METRIC RANK
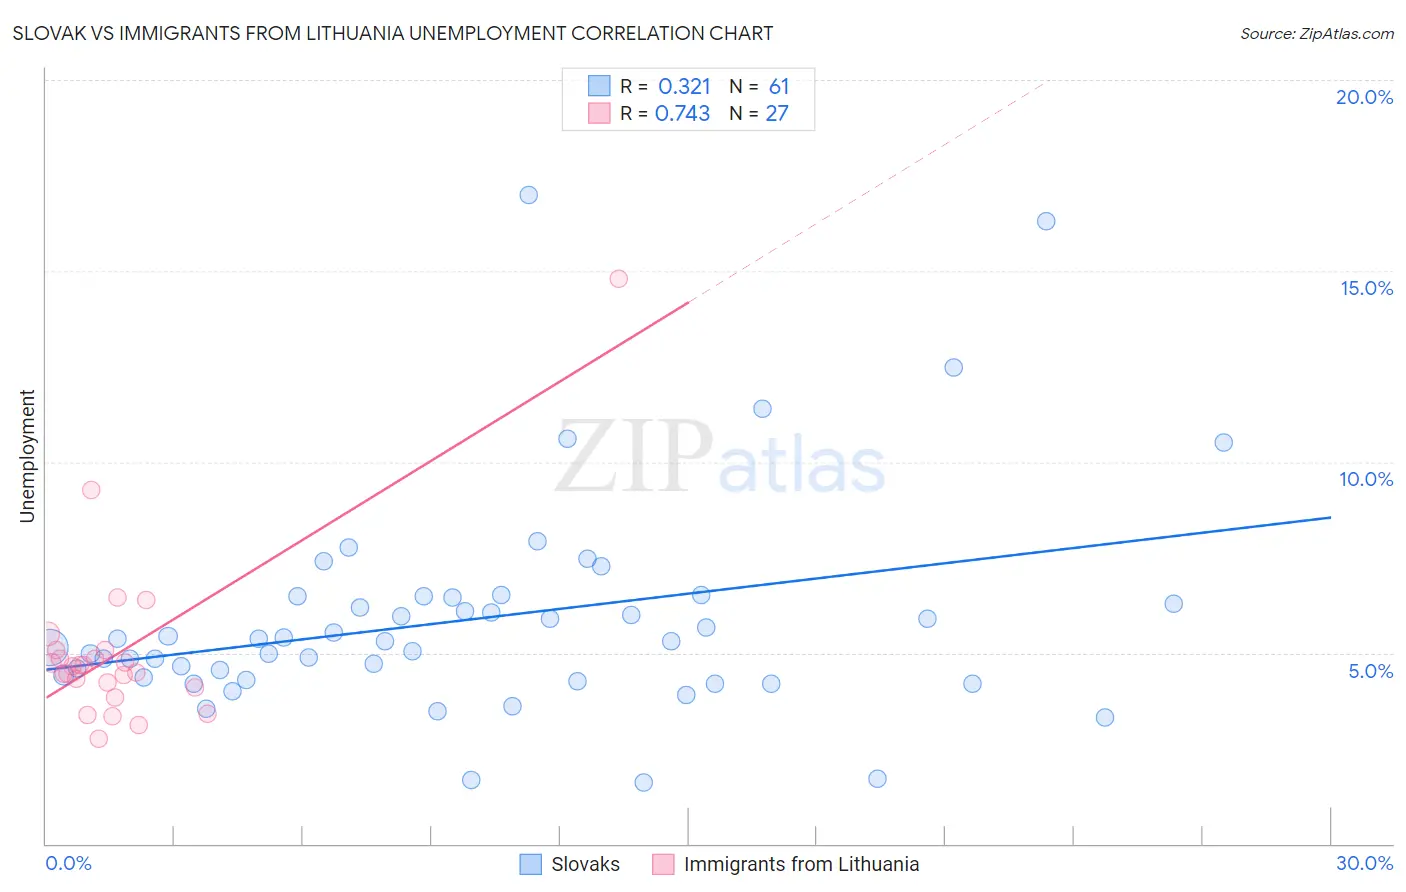
Slovak vs Immigrants from Lithuania Unemployment Correlation Chart
The statistical analysis conducted on geographies consisting of 397,231,194 people shows a mild positive correlation between the proportion of Slovaks and unemployment in the United States with a correlation coefficient (R) of 0.321 and weighted average of 4.9%. Similarly, the statistical analysis conducted on geographies consisting of 117,711,175 people shows a strong positive correlation between the proportion of Immigrants from Lithuania and unemployment in the United States with a correlation coefficient (R) of 0.743 and weighted average of 5.0%, a difference of 2.8%.
Unemployment Correlation Summary
| Measurement | Slovak | Immigrants from Lithuania |
| Minimum | 1.6% | 2.7% |
| Maximum | 17.0% | 14.8% |
| Range | 15.4% | 12.1% |
| Mean | 5.9% | 5.0% |
| Median | 5.3% | 4.7% |
| Interquartile 25% (IQ1) | 4.3% | 4.1% |
| Interquartile 75% (IQ3) | 6.5% | 5.1% |
| Interquartile Range (IQR) | 2.1% | 0.96% |
| Standard Deviation (Sample) | 2.8% | 2.3% |
| Standard Deviation (Population) | 2.8% | 2.3% |
Similar Demographics by Unemployment
Demographics Similar to Slovaks by Unemployment
In terms of unemployment, the demographic groups most similar to Slovaks are New Zealander (4.9%, a difference of 0.040%), Slavic (4.9%, a difference of 0.070%), Immigrants from Canada (4.9%, a difference of 0.15%), Immigrants from North America (4.9%, a difference of 0.16%), and Italian (4.9%, a difference of 0.29%).
| Demographics | Rating | Rank | Unemployment |
| Bhutanese | 99.0 /100 | #59 | Exceptional 4.9% |
| Immigrants | Netherlands | 99.0 /100 | #60 | Exceptional 4.9% |
| Cambodians | 99.0 /100 | #61 | Exceptional 4.9% |
| Icelanders | 98.9 /100 | #62 | Exceptional 4.9% |
| Immigrants | Bulgaria | 98.9 /100 | #63 | Exceptional 4.9% |
| Italians | 98.9 /100 | #64 | Exceptional 4.9% |
| Immigrants | Canada | 98.8 /100 | #65 | Exceptional 4.9% |
| Slovaks | 98.7 /100 | #66 | Exceptional 4.9% |
| New Zealanders | 98.6 /100 | #67 | Exceptional 4.9% |
| Slavs | 98.6 /100 | #68 | Exceptional 4.9% |
| Immigrants | North America | 98.5 /100 | #69 | Exceptional 4.9% |
| Serbians | 98.4 /100 | #70 | Exceptional 4.9% |
| Immigrants | Japan | 98.3 /100 | #71 | Exceptional 4.9% |
| Burmese | 98.3 /100 | #72 | Exceptional 4.9% |
| Paraguayans | 98.3 /100 | #73 | Exceptional 4.9% |
Demographics Similar to Immigrants from Lithuania by Unemployment
In terms of unemployment, the demographic groups most similar to Immigrants from Lithuania are Chilean (5.0%, a difference of 0.0%), Immigrants from Eritrea (5.0%, a difference of 0.020%), Immigrants from Kuwait (5.0%, a difference of 0.12%), Immigrants from Turkey (5.0%, a difference of 0.13%), and Immigrants from Romania (5.0%, a difference of 0.14%).
| Demographics | Rating | Rank | Unemployment |
| Chickasaw | 94.0 /100 | #103 | Exceptional 5.0% |
| Osage | 94.0 /100 | #104 | Exceptional 5.0% |
| Maltese | 94.0 /100 | #105 | Exceptional 5.0% |
| Immigrants | Romania | 93.7 /100 | #106 | Exceptional 5.0% |
| Immigrants | Turkey | 93.7 /100 | #107 | Exceptional 5.0% |
| Immigrants | Kuwait | 93.7 /100 | #108 | Exceptional 5.0% |
| Immigrants | Eritrea | 93.3 /100 | #109 | Exceptional 5.0% |
| Immigrants | Lithuania | 93.2 /100 | #110 | Exceptional 5.0% |
| Chileans | 93.2 /100 | #111 | Exceptional 5.0% |
| South Africans | 92.6 /100 | #112 | Exceptional 5.1% |
| Argentineans | 92.4 /100 | #113 | Exceptional 5.1% |
| Immigrants | Ireland | 92.1 /100 | #114 | Exceptional 5.1% |
| Immigrants | Western Europe | 91.1 /100 | #115 | Exceptional 5.1% |
| Immigrants | Sri Lanka | 91.1 /100 | #116 | Exceptional 5.1% |
| Immigrants | Malaysia | 91.0 /100 | #117 | Exceptional 5.1% |